Lab Five: Geovisualization and Pattern Discovery - Draping Geology and Cultural Features on Topography
|
|
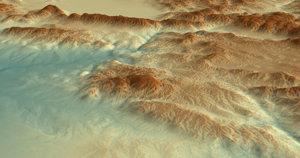
Colo. Geological Survey geology Shapefile
draped over USGS DEM of the
Carbondale, Colo. area. Mt. Sopris
(12,965 ft.) on left, Crystal River drainage on right. |
USGS DRG draped over USGS DEM of same view as left image.
What control does topography have over land use and land cover? |
Lab Five Goals
- to experience real-world applications of geovisualization
- to work with different data models (raster and vector) in a GIS project
- to explore the concept of obtaining pixel elevations from DEM sources (called 'draping')
- to freely rotate and interact with surface models to distinguish patterns and to see relationships
- to learn about and use 'extensions' in ArcGIS (extensions allow users to perform specialized functions)
 Tools
Tools
- ESRI ArcGIS ArcScene Visualization Software
- ESRI ArcGIS Spatial Analyst and 3D Analyst Extension
- Expression Web 4
- Filezilla
- a web browser
Background
In Lab Five, students work with ArcScene, an ESRI ArcGIS software package designed for 3D data visualization and analysis. The user interface in ArcScene is very similar to that of ArcMap. ArcScene provides an environment through which students visualize landscapes by overlaying thematic maps (geology Shapefiles, DRGs) on DEMs. While gaining experience using tools for data visualization and pattern discovery, students explore relationships between topographic relief and geology, drainage systems, land use, land cover, as well as the built environment. The data for the lab include Colorado Geological Survey geologic maps in Shapefile format and 1:24,000 USGS DEMs and DRGs.
Following work from Lab Four, students are expected to know how to add data, select layers, and turn on/off layer displays in an ArcGIS environment.
Lab Five Overview
 Lab Five is divided into three parts: The first involves creating two new folders under the 'lab_5' directory and copying folders from Brandon's faculty drive to student Z: drives. The second part walks students through an ArcScene project in which geology polygon Shapefiles (vector) and DRGs (raster) are draped over DEMs (raster). Also in the second part of the lab, students adjust transparencies of different data layers to enhance what can be seen. The third part involves exploring and interacting with maps to identify patterns between topography (relief on the physical landscape) and other themes of choice. All data used in Lab Five are free and are available for download from various commercial, state, and Federal websites. Lab Five data include 1) USGS DEMs (.dem format), 2) USGS DRGs (.tif + .tfw format),
and 3) Colorado Geological Survey Shapefiles (.shp format).
Lab Five is divided into three parts: The first involves creating two new folders under the 'lab_5' directory and copying folders from Brandon's faculty drive to student Z: drives. The second part walks students through an ArcScene project in which geology polygon Shapefiles (vector) and DRGs (raster) are draped over DEMs (raster). Also in the second part of the lab, students adjust transparencies of different data layers to enhance what can be seen. The third part involves exploring and interacting with maps to identify patterns between topography (relief on the physical landscape) and other themes of choice. All data used in Lab Five are free and are available for download from various commercial, state, and Federal websites. Lab Five data include 1) USGS DEMs (.dem format), 2) USGS DRGs (.tif + .tfw format),
and 3) Colorado Geological Survey Shapefiles (.shp format).
Due Sunday, Apr. 7, 5:00 pm
STOP! READ THE "WHAT I GRADE" SECTION BELOW RIGHT NOW - YOU WILL NEED TO SAVE TWO SCREEN SHOTS
Part One - Getting Set Up
- Create two
new directories (data and project) on your Z drive in your Lab Five folder:
/ges2050/web/lab_5/data/ (use this directory to store the folders/files that you copy from Brandon's faculty drive)
/ges2050/web/lab_5/project/ (use this directory to store the ArcScene project that you will create)
- Into your z drive's /ges2050/web/lab_5/data/ directory, paste ONE of the folders below from bvogt's faculty OutBox ges2050\arcscene_data directory
If you are a geology nerd, you might want to use one of the two last places (Keystone, Cattle Creek) because they include map unit reports (e.g., age of different lithologies).
mt_sopris_co (Carbondale, CO area)
COPY THE ENTIRE mt_sopris_co directory (includes dem, drg, and geology shapefile
or
durango_e_co (Durango, CO area)
COPY THE ENTIRE durango_e directory (includes dem, drg, and geology shapefile)
or
durango_w_co (Durango, CO area)
COPY THE ENTIRE durango_w directory (includes dem, drg, and geology shapefile)
or
grib_prk_co (Salida, CO area)
COPY THE ENTIRE grib_prk_co directory (includes dem, drg, and geology shapefile)
or
keystone_co (Summit County, CO area)
COPY THE ENTIRE keystone_co directory (includes dem, drg, geology shapefile + map units reports as PDFs)
or
cattle_creek_co (Glenwood Springs, CO area)
COPY THE ENTIRE cattle_creek_co directory (includes dem, drg, geology shapefile + map units reports as PDFs)
Part Two - Assembling three different map layers in ArcScene
- Read about ArcScene.
- Open ArcScene. Start with a 'blank scene'
 Turn on two extensions: Customize > Extensions (then check the 3D Analyst and Spatial Analyst box).
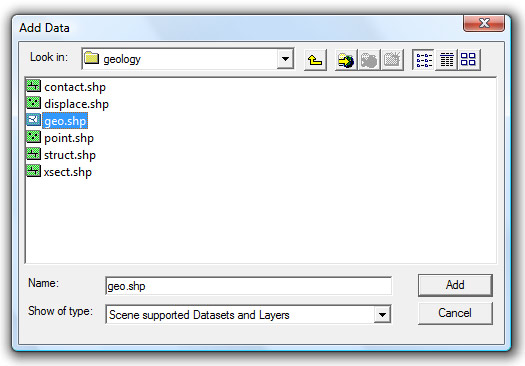
- Using the 'Add Data' icon, add to your ArcScene project i) the DEM, ii) the DRG, and iii) the Geology Shapefile - you copied these from bvogt's OutBox
- When adding the DRG and/or the DEM to your project, you will likely see a window that asks if you want to build pyramids. Say yes.
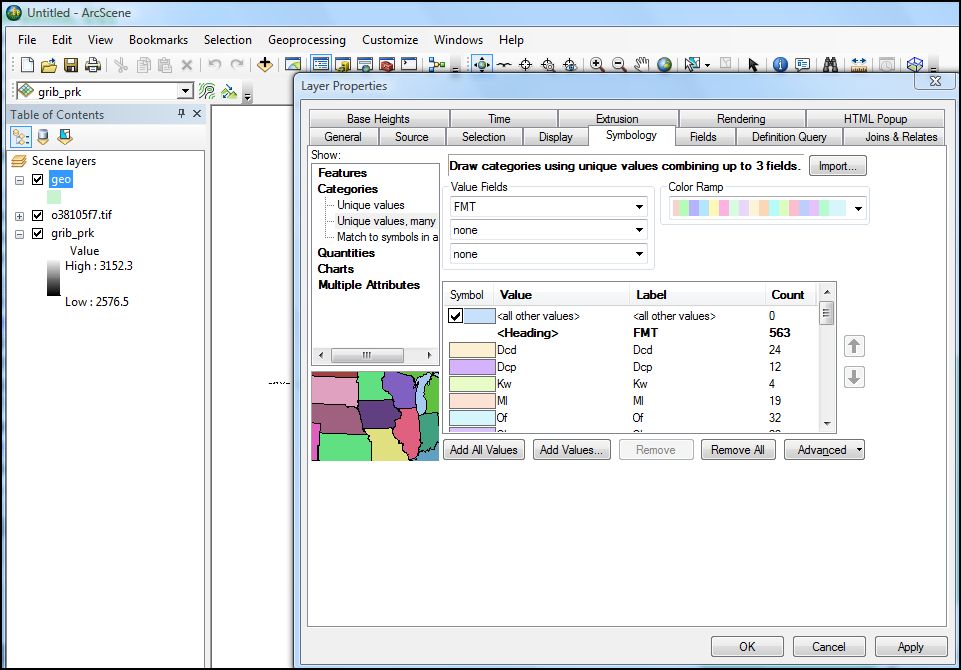
- When initially loaded, the geology Shapefile will display one color for all rock types (e.g., all polygons are same color). You need to make each geology type a unique color: In the table of contents, right-click on the geology layer; go to "properties"; click the "symbology" tab; click on "categories" and select "Unique values, many fields"; change "Value fields" pull down menu to 'FMT' (or "DESCRIPTIO"). Click the "Add All Values" button and say OK. (here are the settings for grib_prk). Your geology Shapefile should now look something like this. "FMT" (or "DESCRIPTIO" values are the geologic unit names.
- The next step is to remove the geologic units' polygon borders (outlines). In some cases, the borders take up so much space that they can obscure the geology layer polygons: In the table of contents, right-click on the geology layer; go to "properties"; click the "symbology" tab; click on "categories" and select "Unique values, many fields." Right-click on any of the symbol colors and select "Properties for All Symbols..." Change the outline width to 0, click OK, and then OK again. Does the geology layer look less cluttered?
- Save your ArcScene document (.sxd) to your ges2050/web/lab_5/project directory.
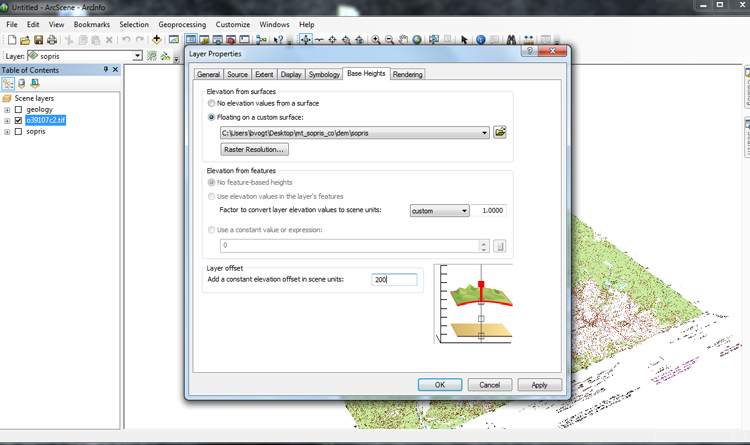
- Now it is time to drape the geology and DRG layers over the DEM: Start with the geology layer - Right-click on the geology Shapefile in the table of contents, go to "Properties"; select the "Base Heights" tab. Check "Floating on a custom surface" and set the source to your DEM (e.g., grib_prk or durango_e or sopris). Leave the other defaults. Click okay.
- Uncheck (turn view off) the DEM and DRG layer's displays so you view only the geology (which now should float above and conform to the DEM). Pretty cool, eh?
- Use Arcscene's 'navigate' icon (the globe with the four arrows around it) to change your data view perspective. Remember: BE PATIENT when you move your displays.
- Next, drape the DRG (the .tif) over the DEM. This time, drape the image
200 meters over the DEM (change the "Layer offset" from 0 to 200). Don't forget to select the 'floating on a custom surface' and SELECT THE DEM as source (topography has to be the surface from which the DRG associates its values).
- This will stack your two layers separately on top of the DEM with a 200 meter buffer. Zoom in a bit.
- To improve the clarity of the DRG (to make the image much less grainy), right-click on the DRG in the table of contents, go to properties, select the "rendering" tab, and slide the "quality enhancement for raster images" slider all of the way to the right (to 'high'). Another way to enhance the scene is to add shading. To do this, in the 'Effects' area of the 'Rendering' tab, select the "Shade areal features relative to the scene's light position." Select okay. Your new DRG will look something like this.
- Also to improve the visual experience when working with DRGs, right-click on the DRG in the table of contents, go to properties, select the "rendering" tab,
- Next, in the geology layer properties 'display' tab, change the transparency to 50%. You can use this tool to easily adjust the transparency of different layers. Here's an example of the result. Experiment with this.
- Save your ArcScene document.
Part Three - Pattern discovery through geovisualization
 This is the fun part. Explore. Surf you map layers. Adjust the zoom and use the 'navigate' icon to adjust, twist, turn, and move, your DRG and your geology layers. Get crazy man! What do you see? What sort of general statement can you make about patterns and relationships between topography and any number of other themes or features? In other words, use your imagination and your knowledge of geography to seek out a relationship between topography, themes on the DRG, or patterns on the geology layer. Ask yourself: How does topography control or influence the themes found on my maps?
- The goal here is to identify (and discuss in a paragraph or two) the relationship between 1) elevation/topography (your DEM) and 2) any other theme of choice such as rivers, geomorphology, anthropogenic landscapes, land cover, transportation, etc. On your Lab Five web page, be sure to use TWO IMAGES/SCREEN CAPTURES WITH CAPTIONS to illustrate this relationship.
WHAT I GRADE:
1) Map report narrative: In a well-written paragraph or two, students must first identify and then discuss the relationship between topography (the DEM) and a theme of choice such as geology, geomorphology, rivers/drainages, anthropogenic landscapes, land cover, land use, transportation, climate effects on the landsurface, etc. In other words, clearly and succinctly articulate how a region's topography is related to an identifiable geographic theme. SPEND SOME TIME THINKING ABOUT AND WRITING THIS REPORT.
2) Two images, each with a caption:
- both images must illustrate and support your map report narrative. Please make references to the images in your narrative.
|
|
Durango West |
Durango East |


