Lab Eight: Colorado Fourteeners, Pixel by Pixel
|
|
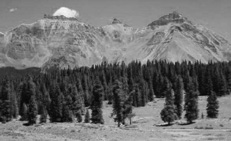
Two Colorado 14ers or three?
|
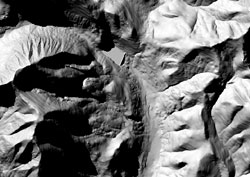
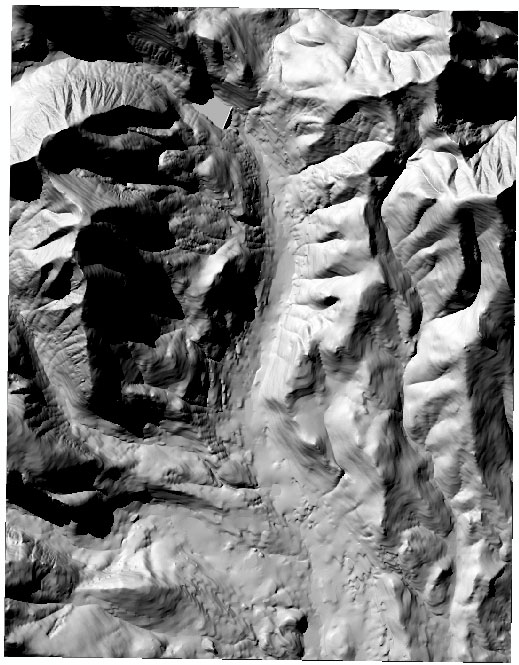
Hillshade of Alma,
CO
1:24000 DEM |
 Lab Goals:
- to use tools of spatial analysis to address a social issue: when is a 14,000+ ft. peak in Colorado a true Fourteener (14er)?
- to observe on a DEM information related to erosion and weathering (landform evolution/geomorphology)
- to create contour lines and index contour lines
- to understand issues of resolution related to DEM elevation values and contour line shapes in plan-view
- to work with a map calculator to
edit DEM grid values
- to classify a DEM to display a subset of elevation values
- to gain experience using a roving window
(neighborhood operator) to, in this case, display topographic variety
 Lab Tools:
- 10 and 30 m resolution USGS 1:24000 Alma, Colorado DEMs
- ESRI ArcMap with Spatial Analyst Extension and 3D Analyst Extension
- File Explorer
- Expression Web 4
- Filezilla
- a web browser
 Introduction:
A 'Fourteener' (14er) is a term describing a 14,000 ft. or higher summit in Colorado. There are more or less 53 14ers in Colorado. Climb or 'bag' them all, as thousands of people and dozens of dogs have done, and you'll earn the title "Dr. Colorado." The web site 14ers.com provides an organized source of information for Colorado 14ers, including images, routes, and a difficulty rating system. Other regions subscribe to similar peak-bagging themes. As examples, check out Adirondack 46ers, Arizona's 20-20 Challenge, and Scotland's Munros.
This lab focuses on a group of 14,000 ft.+ peaks in Colorado's Mosquito Range. The group of peaks are in Pike National Forest (near Alma, Colorado) and are all found on the Alma, Colorado 1:24,000 US Geological Survey (USGS) digital elevation model (DEM). The peaks of interest are Mt. Cameron, Mt. Bross, and Mt. Lincoln. According to Colorado 14er purists and Gerry Roach, the author of the popular 14er book Colorado's Fourteeners: From Hikes to Climbs, only two of the aforementioned three 14,000 ft.+ peaks qualify as official 14ers. Why not all three mountain summits in the group? Answering this question is a theme of this lab!
Also -- ifyou are interested -- here is a paper that discusses the Colorado Fourteeners from a lightning hazards perspective.
A second theme of the lab involves exploring the relationship between process (weathering, erosion, mass wasting, human disturbance) and form (valley morphometry and surface texture) in a Colorado Alpine environment. To get a closer look at the 'form' (or the geomorphometry) part, students perform a variety of spatial analysis operations on DEM files. These operations include calculating slope, hillshade, and generating contour lines. Also, students calculate the topographic variety of the Alma, CO DEM using a 'neighborhood statistics' tool (topographic variety serves as a proxy for surface roughness). Students are asked to look for human impacts in the landscape as well (e.g., reservoirs, road-cuts, road beds, mining activity, artificially oversteepened slopes). Other more mechanical tasks performed in the lab are the reclassification of DEM data in order to select a subset of elevation values and the use of a raster (map) calculator to convert from meters to feet. From the suite of new map products created, a couple questions are asked about the 'process' part.
A third theme involves comparing measures made from two different map resolutions. For example: How are contour lines drawn on a 10 meter versus a 30 meter DEM of the same area? Is precision in measurement lost using the more coarse (30m) DEM data? To address this and other geomorphometric issues, students compare pixel values and contour lines between the 10 m and 30 m Alma, CO DEMs.
Due date: Sunday, April 28 by 5:00 pm
Graded items:
Students are required to place four images (each with caption) and the answers to questions 1 - 8 below on their Lab Eight web page.
Specifically, the following are graded:
- one image (with caption) showing a close-up of the saddle (with contour lines) connecting Mt. Cameron and Mt. Lincoln
- one image (with caption) showing all elevations above 14,000 ft. on the Alma, CO DEM
- one image (with caption) showing the results of the slope analysis of the Alma, CO DEM
- one image (with caption) showing the results of the variety analysis of the Alma, CO DEM
- Answer the following:
- 1. In terms of square meters (m^2), exactly how much area (m^2) is covered by ONE PIXEL on a 10 m DEM and on a 30 m DEM?
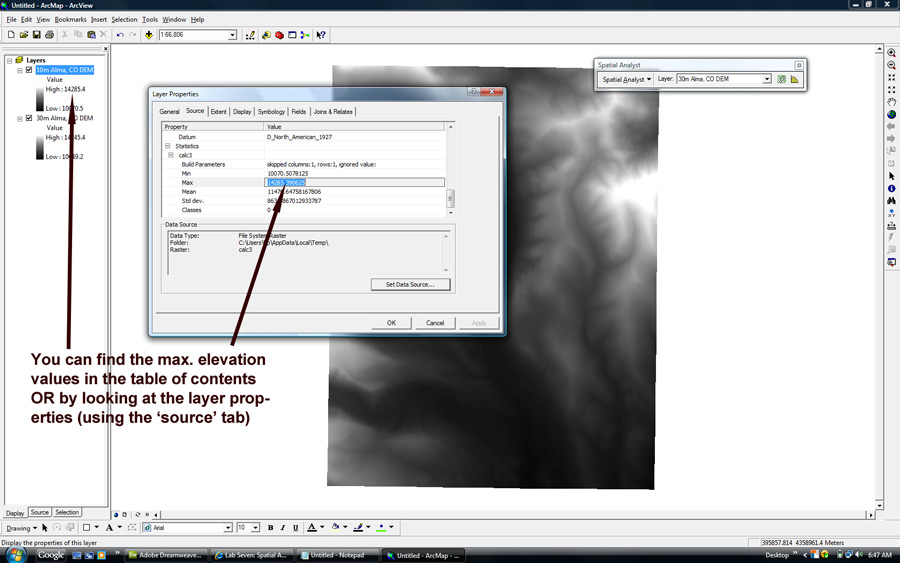
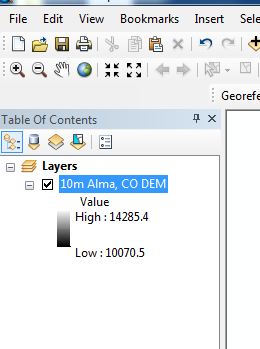
- 2. What is the highest elevation value on the 10 m Alma, CO DEM? What is the highest elevation value on the 30 m Alma, CO DEM (HERE IS WHERE YOU FIND THIS INFORMATION) and why do you suppose the 10 m and the 30 m versions of the same map show different maximum elevations?
- 3. According to 14er 'rules,' one must descend 300 feet between 14ers for an adjacent 14,000 ft. + peak to be an official 14er (Roach 1999, pg. 287). What is the vertical elevation loss between Mt. Cameron and Mt. Lincoln? According to 14er rules is Mt. Cameron an official 14er?
- 4. Which landforms on your DEM show the lowest slope values (e.g., the gentlest slopes)?
- 5. Which landforms on your DEM show the highest slope values (e.g., the steepest slopes)?
- 6. Based from the slope analysis, what natural/physical PROCESSES do you suppose form STEEP slopes and what processes do you supposed generate GENTLE slopes?
- 7. Based from slope analysis, hillshade analysis, and/or variety/range analysis, provide one example of human (anthropogenic) forms visible on the DEM. Describe likely processes responsible for shaping this/these form(s).
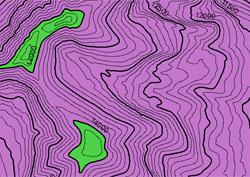
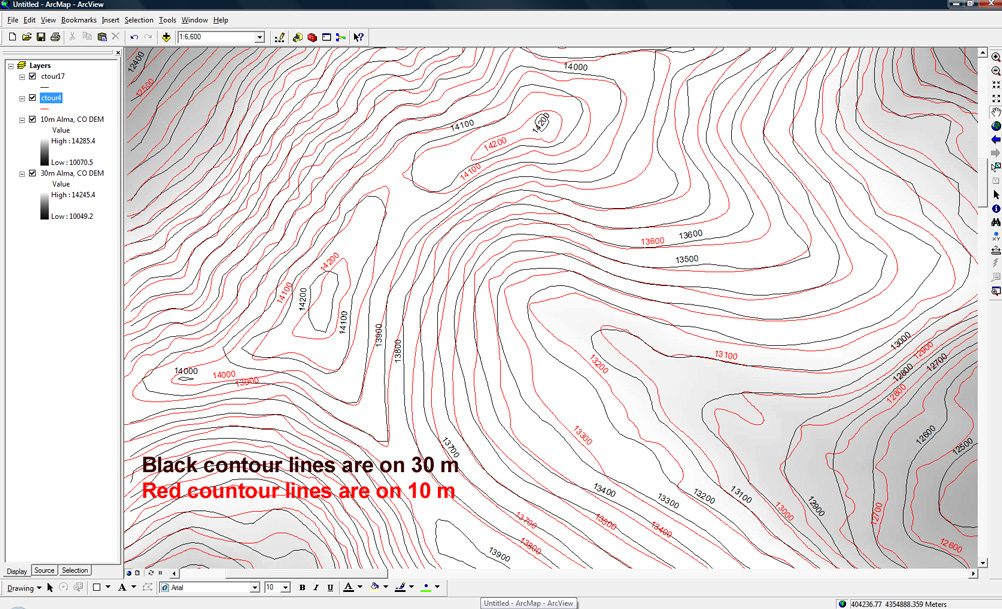
- 8. This image, like the one you created, shows contour lines added to both the 10 m and the 30 m DEM. Why are the contour lines different (e.g., why do the lines follow slightly different paths) for the two different resolutions?
 Overview: This lab contains four parts.
- Part One - Getting set up: Create new directories, copy DEMs
- Part Two - What's up with Colorado 14ers: Investigate 14ers on the Alma, CO DEM
- Part Three - Form process, process form: What processes can be interpreted from form?
- Part Four - 10 meter vs. 30 meter resolution DEMs: What is different and why?
 Part One - Getting set up:
- Create two new directories in your ges2050/web/lab_8 folder:
>
one named dems
>
one named project
- From Brandon's faculty outbox, copy TWO directories to your lab_8/dems/ directory:
> For the 10 meter Alma, CO DEM, copy the 10_m directory: Faculty\bvogt\OutBox\ges2050\alma_30_10\10_m
> For the 30 meter Alma, CO DEM, copy the 30_m directory: Faculty\bvogt\OutBox\ges2050\alma_30_10\30_m
Part Two - What's up with Colorado Fourteeners?
|
|
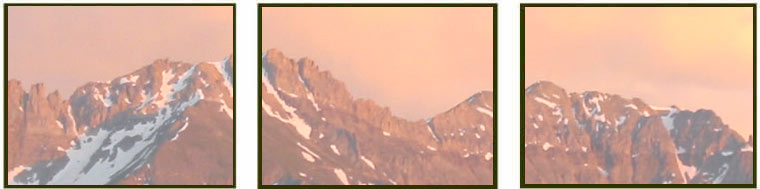
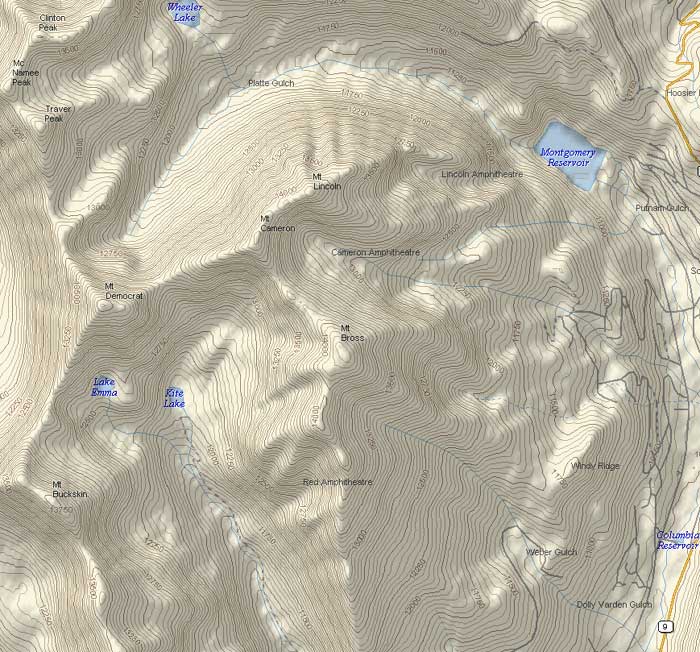
Figure 1. Helper image for Part Two. The region of interest: Mt.
Lincoln, Mt. Cameron, and Mt. Bross. Image from 14ers.com
|
- Open ArcMap. Turn on the Spatial Analyst Extension (Customize > Extensions (check Spatial Analyst), close). Next, turn on the Spatial Analyst Toolbar (Customize > Toolbars > Spatial Analyst). The Spatial Analyst toolbar should appear in your project window.
- Save your ArcMap (.mxd) project (File > Save As) to your lab_8/project directory. Give the project a name like 'lab_8'.
- For now, add only the 10m DEM to your ArcMap project (use the 'add data' icon, navigate to your 10m DEM, named 'ten'). If prompted to create pyramids, leave the defaults alone and say yes.
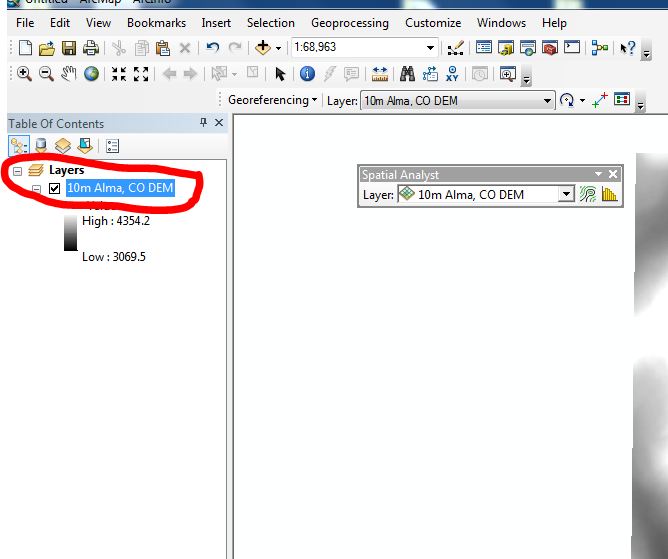
- Rename your DEM: From ArcMap's Table of Contents window, rename the DEM '10m Alma, CO DEM'
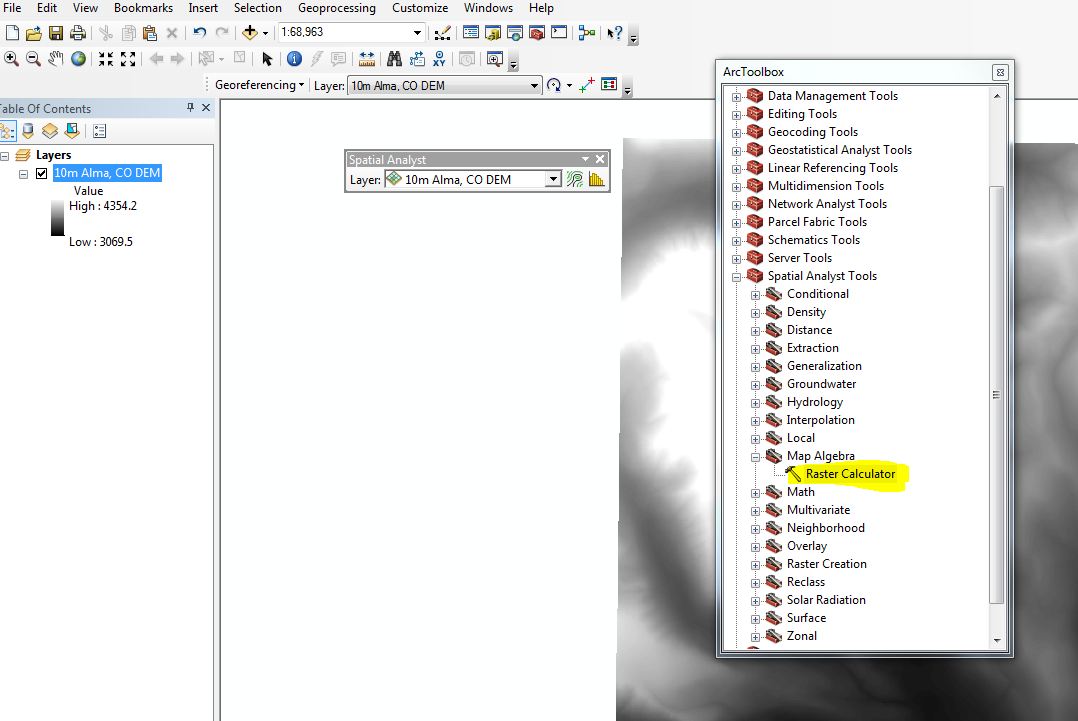
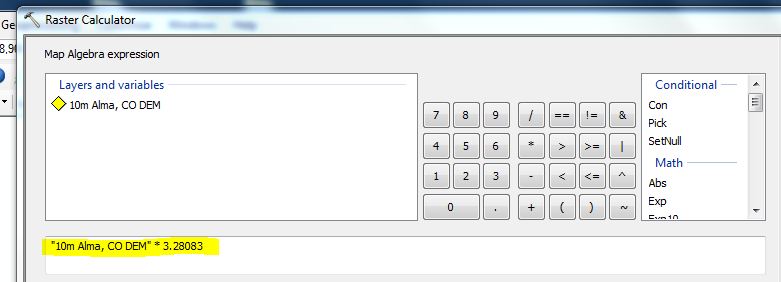
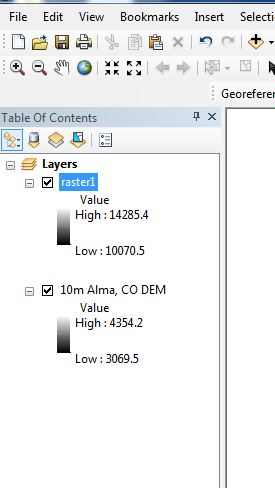
- Change units to feet: Notice that by default the DEM pixel values are in meters. Use Raster Calculator to convert from meters to feet. To open Raster Calculator, first open ArcToolbox (click on the little icon with the red toolbox). Next, in ArcToolbox, navigate to Spatial Analyst Tools > Map Algebra > Raster Calculator. Open Raster Calculator. In Raster Calculator, double click on the layer "10m Alma, CO DEM", then click the multiply icon (*), then type 3.28083 (there are 3.28083 feet in one meter). When your Raster Calculator formula looks like this, click "Okay" WAIT A MINUTE OR SO and your result should look like this.
- Remove original DEM: With values for your 10m DEM in feet, delete (right-click > remove) from the table of contents the original DEM displayed in meters.
- Rename the new DEM: Rename the new DEM, which is now in feet,'10m Alma, CO DEM'
- Add hillshade to your 10 m DEM: From ArcToolbox, Spatial Analyst Tools > Surface > Hillshade. Use the defaults (don't check the 'Model shadows' box) but make sure you save the 'output raster'. Make sure that the 'Ourput raster' location is your z: drive Lab 8 folder. Your new hillshade map should look like this.
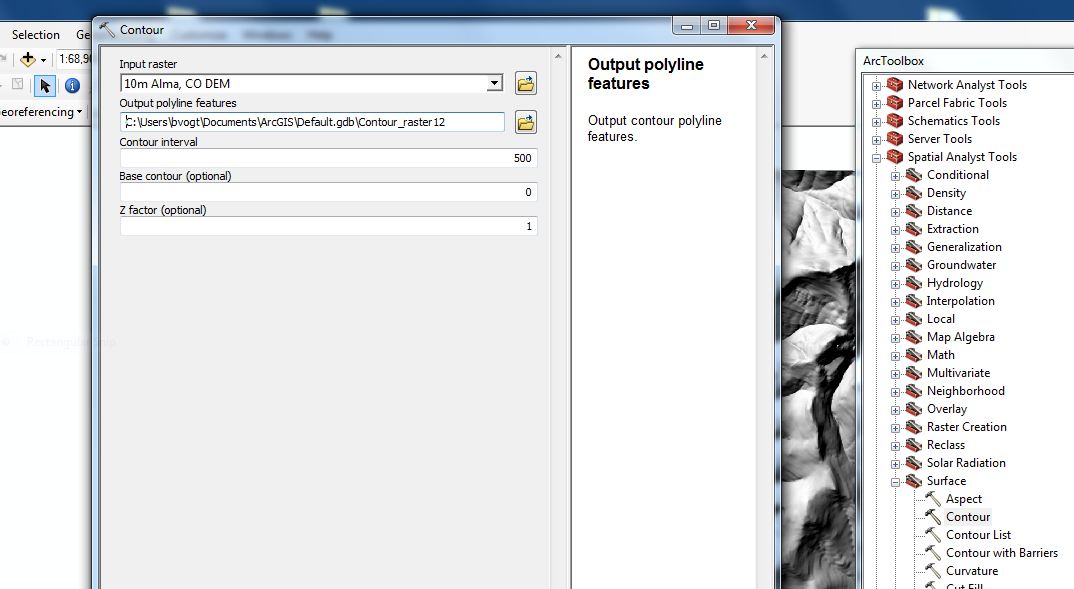
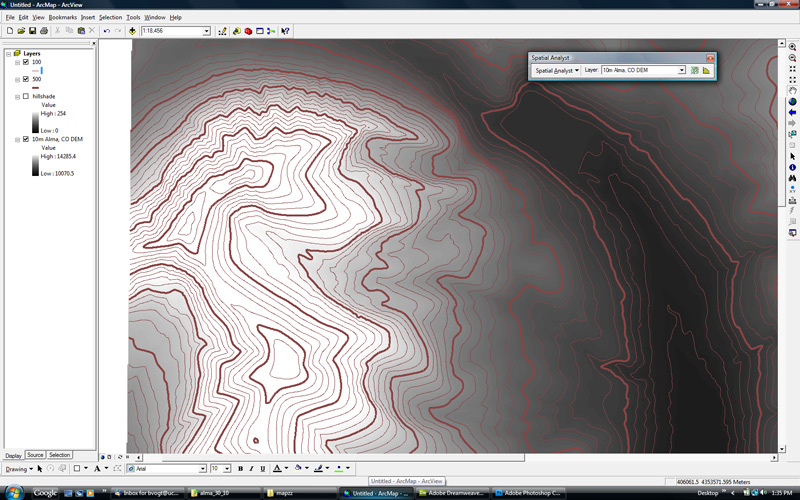
- Add two sets of contour lines to your 10 m DEM: Add contour lines at 500 ft. intervals (ArcToolbox, Spatial Analyst Tools > Surface > Contour) to your DEM. Also, to the same DEM, repeat the same process but this time add contours at 100 ft. intervals. In the Table of Contents, rename the 500 and 100 ft. contour lines '500' and '100'. Also from the Table of Contents, make the 500 ft. contour lines INDEX contours (make them thicker than the 100 ft. interval contour lines). Feel free to change the colors of both sets of contour lines.
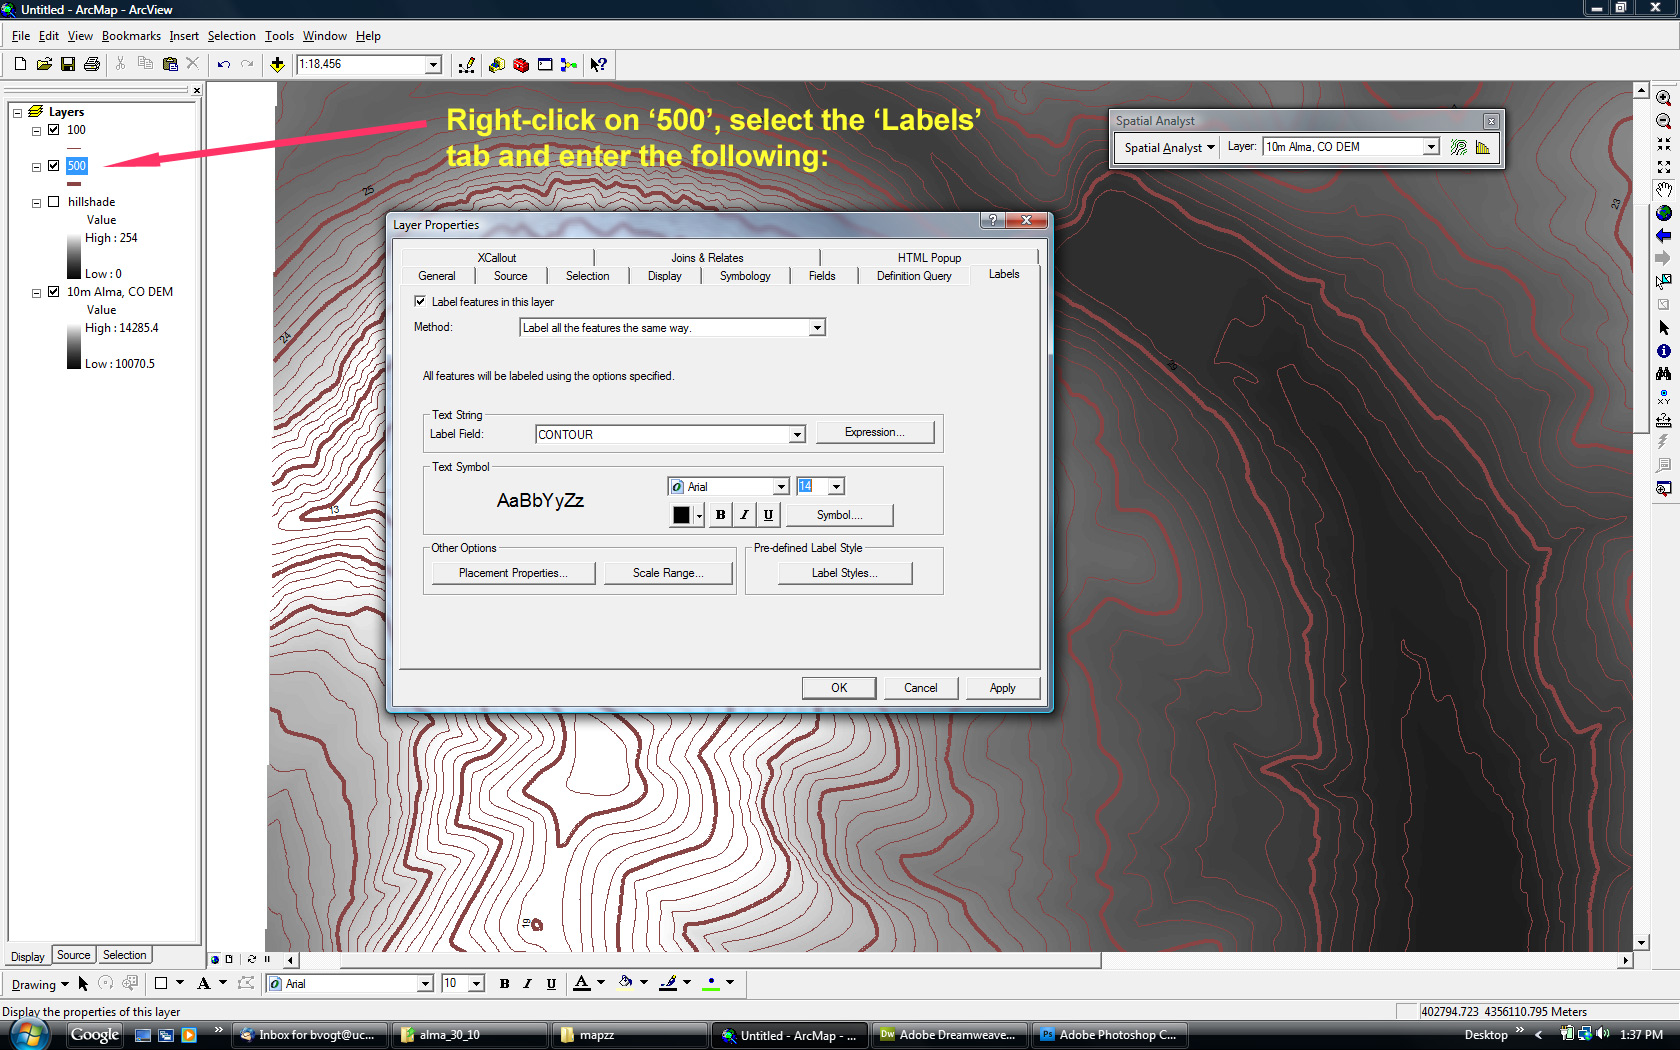
- Add contour line labels to the 500 ft. contour lines: Add contour line labels to the 500 ft. contour lines in 14 pt. Arial Black Font. Turn on the labels by right-clicking on the 500 ft. layer in the table of contents and selecting 'Label Features'.
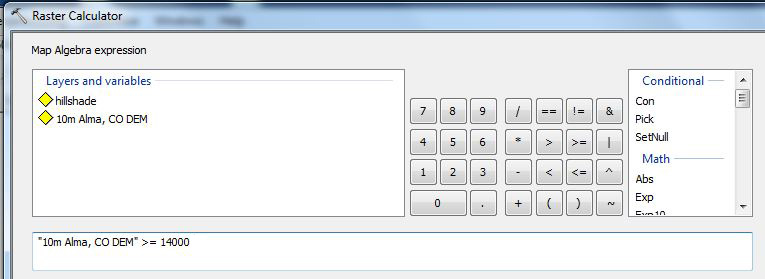
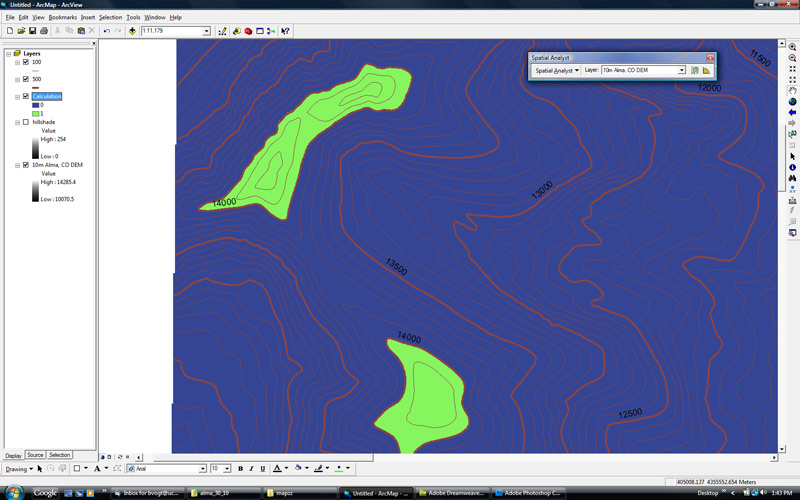
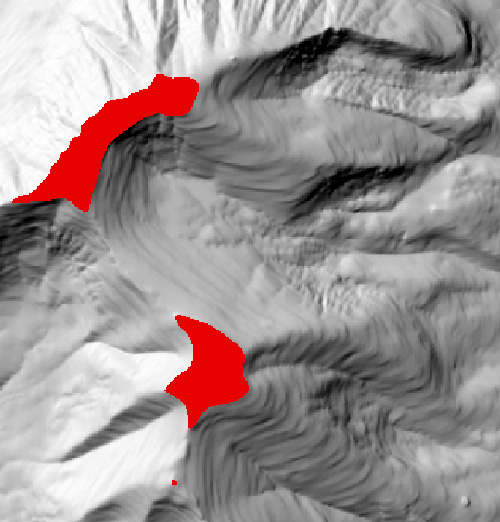
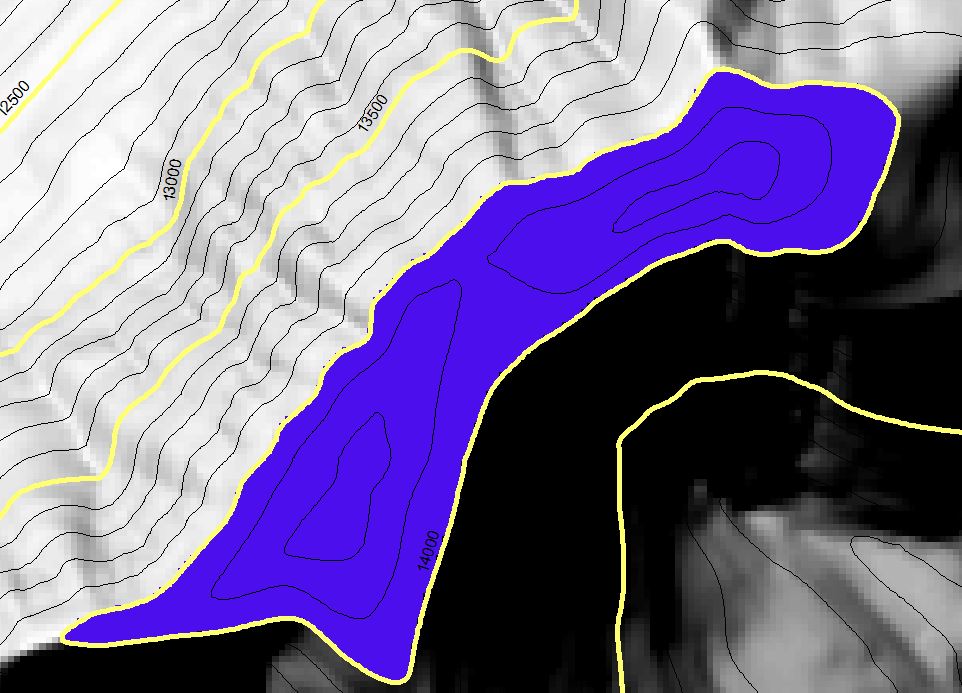
- Show only elevations over 14,000 ft.: Use the Raster Calculator (From ArcToolbox, Spatial Analyst Tools > Map Algebra > Raster Calculator) using these settings to map only the DEM values above 14,000 ft. Your project should now look something like this. Make everything BELOW 14,000 ft. 'no color'. Do this from the Table of Contents (double-click on the color '0' and change the 'Fill Color' to 'No color'). Your resulting map (over hillshade only) will look something like this. SAVE THIS IMAGE (See 'Graded items' section)
- Zoom in to the 14ers region in your map: Use Figure One at right to help locate the three peaks above 14,000 ft. SAVE THIS IMAGE (See 'Graded items' section)
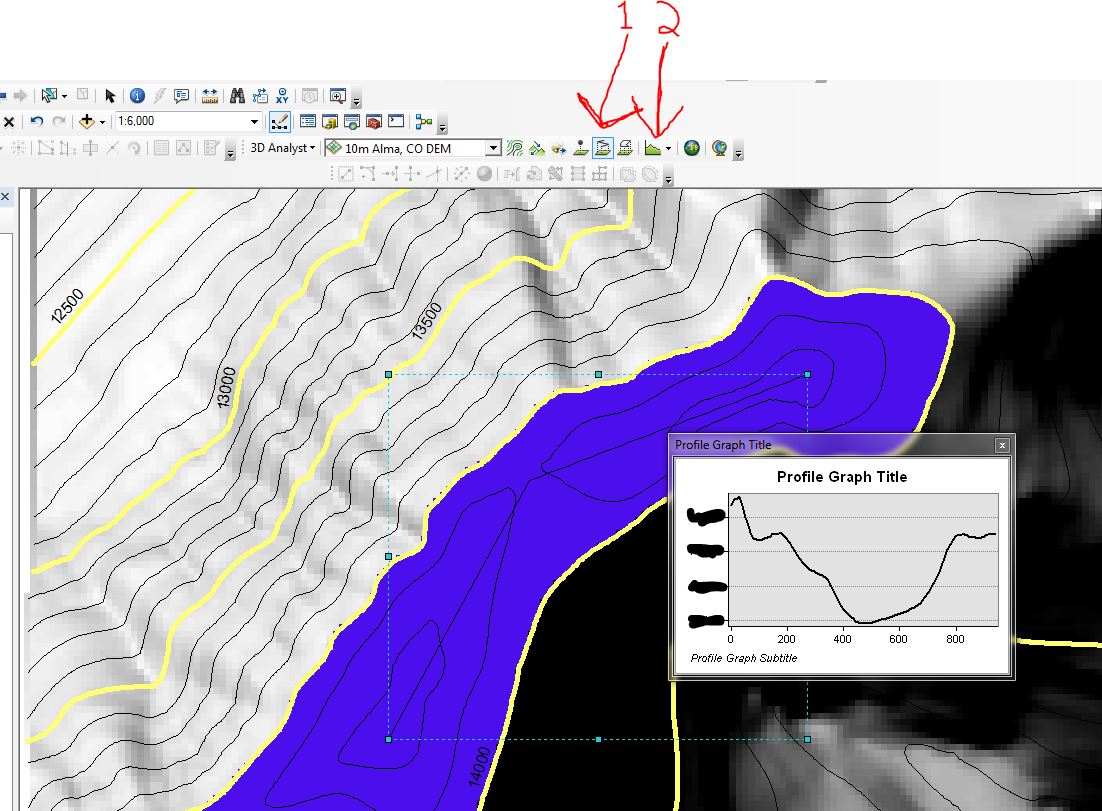
- Measure elevation loss to bottom of saddle: Next, you'll need to measure the elevation loss that one would experience when walking DOWN to hike from Mt. Lincoln (~14,286 ft.) directly over to Mt. Cameron (~14,238 ft.). In other words, staying as high as possible from Mt. Lincoln, how low does the saddle descend that connects the two peaks?
- There are a couple ways to extract this elevation loss value. One is to use a tool available with the '3D Analyst' extension: Turn on the 3D Analyst Extension (Customize > Extensions (check 3D Analyst), close). Next, turn on the 3D Analyst toolbar (Customize > Toolbars (check 3D Analyst)). First, use the 'Interpolate Line' tool, second, use the 'Profile Graph' tool. This will create a histogram showing elevation change. Another method to measure elevation loss is to create fine scale contour lines that you can count on the DEM (WRITE THIS NUMBER DOWN). Keep in mind that Mt. Lincoln is an "official" 14er. Also note that Mt. Democrat is not shown on the DEM.
- Save your project.
Part Three - Form process, process form: What processes can be deduced from form on a DEM?
- SLOPE
- Slope analysis background: slope can be a helpful measure for understanding landform evolution processes. For example, gentle slopes can indicate depositional features like sandbars and other water-deposited features, while steep slopes can indicate erosional features like a glacially-carved valley, cirque walls, 'young' glacial moraines, and stream cut-banks.
- Perform a Slope Calculation:(In ArcToolbox: Spatial Analyst Tools > Surface > Slope) on your 10 meter DEM. SAVE YOUR SLOPE IMAGE (See 'Graded items' section)
- VARIETY
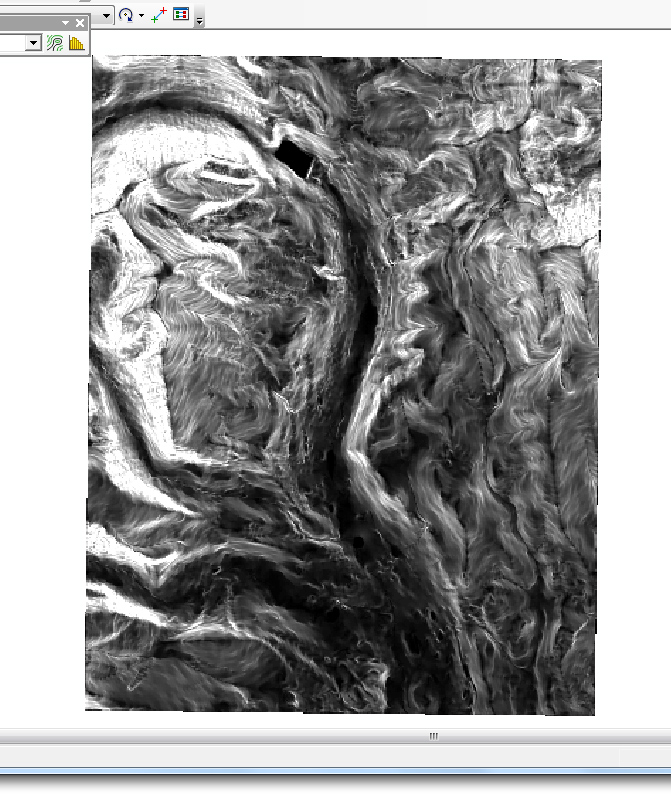
- Variety analysis background: We are using the range of elevation values in a neighborhood of pixels as a proxy to measure surface roughness. As per ESRI, range "calculates the range (difference between largest and smallest value) of the cells in the neighborhood." In this case, higher roughness (higher surface complexity) means higher surface area, and this might be helpful to understand landform evolution processes such as distinguishing between rock weathering processes (frost-shattered rocks) and rock erosion processes (rivers, glaciers). Let's measure the variety/range of the 10 m DEM:
- Perform a Variety/Range Analysis using the 'Range' statistic: On the 10 m DEM, perform an 3 x 3 rectangle neighborhood analysis (In ArcToolbox: Spatial Analyst Tools > Neighborhood > Block Statistics) using range (use these settings). The operation might take a few moments to run... Here's what the resulting map should look like. This image can be used as a proxy for topographic roughness. SAVE YOUR RANGE IMAGE (See 'Graded items' section).
- Save your project.
Part Four - 10 meter vs. 30 meter DEMs: What's different?
- Add the 30 m DEM to your ArcMap project (use the 'add data' icon, navigate to your 30m DEM, which is named 'thirty'). If prompted to 'build pyramids,' say yes.
- You can remove all map layers but the 10 m and the 30 m DEM.
- Make sure both DEMs are in feet (you will need to convert the 30 m DEM to feet).
- Next, let's look at the maximum elevations on the 10 and 30 m DEMs. They should be the same, right? Well, they are not! (at this point, answer question 2 from above)!
- Like you did in Part Two above for the 10 m DEM, add contour lines at 100 ft. intervals to the 30 m DEM (this is important - make sure you have a set of contour lines on the 10 m DEM and on the 30 m DEM).
- Turn on (view) both sets of contour lines.
- Use your contour line map and the one provided in question 8 to answer question 8.
- Save your project.