Lab Three: Estimating the Extent of Urban Sprawl
and Other Exciting Geographic Explorations
Ideas for the urban sprawl portion of this lab were borrowed from here
Lab Three Goals
- To gain experience using mouse clicks to define polygons (a process similar to digitizing), collecting measurments from maps, working with real-time imagery, and interacting in cartograpic spaces, all while keeping the theme of geography in mind. This is achieved by:
- Exploring the VG SkylineGlobe
- Exploring Fairfax County, Virginia GIS and Mapping Services Virtual Fairfax VG application
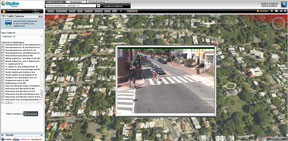
- Exploring traffic cameras in TrafficLand.com and EarthCam.com
Overview
In this lab, you will explore two VGs (SkylineGlobe, Virtual Fairfax) and traffic camera websites. From the different web-based portals, you will learn a great deal about the measurement and presentation of geospatial data in exciting, colorful, interactive environments.
> SkylineGlobe is a free, downloadable VG application that is similar in many ways to Google Earth. SkylineGlobe offers perhaps a bit more than other VGs in terms of tools for geospatial analysis. Using the 'Live' feature in SkylineGlobe, users (should) have near real-time access to weather data, financial data, and recent earthquake activity maps. In SkylineGlobe, you are actually doing GIS by interacting with and asking questions of geospatial data stored on a remote data server. You will use your mouse to digitize (create polygons on a map) regions to estimate land area covered with urban sprawl.
> In Virtual Fairfax, you query a database in search of various places. Once these places are in your view, you will use the built-in toolbar to capture hotlinks (urls) that link back to these places (this is similar to sharing Google Earth KMLs). Here too, you will also answer a few map-related questions. Both SkylineGlobe and VirtualFairfax use a plug-in called 'TerraExplorer' to enhance the user experience. Without this plug-in installed, the functionality is limited. For example, you will not see the 'Project Tree' items that you need to complete the lab (note - this is a free plug-in that you can install on your personal computer).
> Using TrafficLand.com and EarthCam.com (OR ANY TRAFFIC / CITY CAMERA SITES YOU FIND, (this is fun), you will use live traffic cameras to make general statements about the fashion sense (yes, fashion, as in clothing and hair styles) of two large metropolitan areas such as Baltimore, Atlanta, London, Quebec City, and Montreal. You will use four images to support your comparative fashion statement. There are hundreds of traffic cameras from which to pick. Many of the cameras include crosswalks and sidewalks in their viewshed - these are the ones you are after!
To summarize: In Lab Three, you will use various VGs to complete three sets of tasks: you will 1) estimate urban sprawl covering major US cities, 2) explore Northern Virginia, and 3) using real-time traffic and crosswalk camera imagery, make general fashion statements about urbanites in two cities based on people visible in traffic cameras that are using crosswalks and sidewalks.
Like previous labs, all images that you post to your web page MUST contain a descriptive caption (immediately below the image) that interprets the scene according to you. You are also responsible for answering the questions below in red.
Due Date: 5:00 pm, Sun., Sept. 25
Tools Needed
- A calculator
- SkylineGlobe VG
- Virtual Fairfax VG
- TrafficLand and EarthCam sites
- Adobe DreamWeaver
- FileZilla
- A web browser
Steps to Complete Lab Three
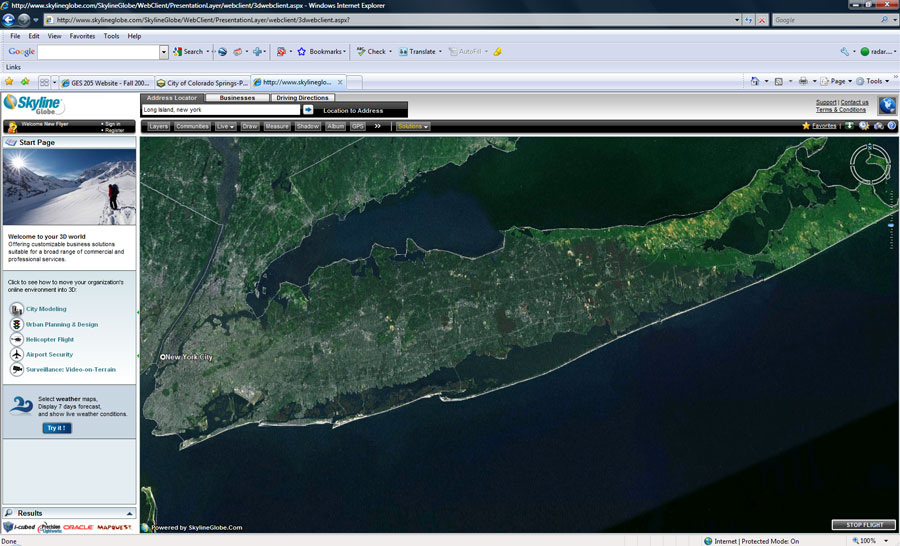
Part One - SkylineGlobe: Percent Urban Sprawl on Long Island, New York
- Using Internet Explorer, go to SkylineGlobe (http://www.skylineglobe.com).
- Scroll down and click on "SkylineGlobe USA Try It Out."
- You may be asked if you want to open skylineglobe6.fly - say yes (or 'open').
- Notice how, unlike Google Earth, SkylineGlobe runs directly out of a web browser.
- Notice that you can add Google Earth .kmz / .kml files, as well as other geospatial files, to SkylineGlobe.
- Practice this yourself: Home tab > Feature Layer > Google Earth (*.kml, *.kmz). Copy / paste the file's URL into the box (e.g., https://academics.uccs.edu/~bvogt/courses/ges2050/labs/google_earth/kmls/gtnp.kmz ). Later, you'll need to paste the complete URL of your favorite place .kmz file that was due as part of Lab Two last week
- Zoom in to the East Coast of the US
- Navigate to Long Island, New York.
- Next, in the 'Project Tree' menu on the left, look at the 'World Data'. Examine the major US cities listed in 3D and in 2D (you can fly to them by double-clicking). Notice the urban sprawl (as indicated by land cover / land use) around each of five cities (Boston, Chicago, New York, Washington DC, and San Francisco).
- You'll need to use a specific tool to estimate the area covered by urban sprawl in Boston, Chicago, New York, Washington DC, and San Francisco.
- Click on the 'Analysis' tab and then select ‘Area' > 'Terrain Area'
- Using mouse clicks, create polygons to define the various urban sprawl areas around these five US cities.
- Right-click when you are finished with each city polygon and write down the area covered by each polygon. For 'Calculation Type' use Square Miles (write these numbers down).
Part Two - Using Traffic Cameras to Interpret Fashion
- Go to TrafficLand.com (http://trafficland.com) and go to EarthCam.com (http://www.earthcam.com/).
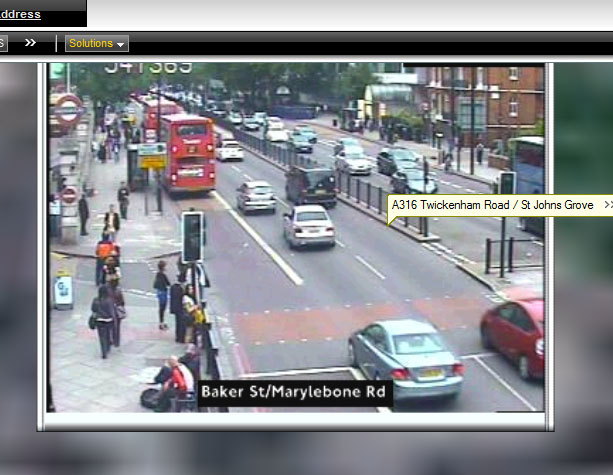
- Pick two cities from across the (virtual) globe. Surf and explore the various cameras found throughout the cities until you have found active crosswalks or busy sidewalks. Find people (like these blokes in London) and evaluate their fashion sense (I know.. this is silly, but fun and interesting I hope)!
- Think about the local time and rush hour(s) as you look for pedestrians.
- Find and save two images from two different regions (this means that you will post four images total (that capture pedestrians) to your Lab Three website; two images of people from each of the two cities)
- Include captions for each image.
- Write one or two short paragraphs: your 'fashion statement' - include concluding remarks.
Part Three - Virtual Fairfax: Linking to place
- Go to Virtual Fairfax (http://www.fairfaxcounty.gov/gis/virtualfairfax/) [As of 2016, Fairfax County, VA has over 1.1 M residents (this is 14% of the whole state's population) and was the first county in the US to reach a median household income in the 6 digits]
- Click on 'Launch the Virtual Fairfax Application'
- To orient yourself, in the table of contents, click on 'Fairfax County Full Extent.' You'll see Fairfax County and its relationship to Washington, DC and Northern Virginia.
- Take the "Historic Sites" tour
- Under 'More POI', look at the "I-95 Interchange - Mixing Bowl," "George Mason University," and "Dulles International Airport"
- Make sure the toolbox is displayed (click on 'Display Toolbox')
- On the toolbox, click 'Display Longitude, Latitude, and Altitude' icon (experiment with how this works)
What I grade:
From Part One: SkylineGlobe
- Q/A: Answer the following questions directly on your Lab Three web page (include questions please):
- In square miles, what is the total area of Long Island, NY?
- What factors do you think contribute to high urbanization on Long Island?
- Which of the five US cities you examined contain the most area covered by urban sprawl?
- How were you identifying urban sprawl. Color? Texture? Brightness? Explain.
- Using simple division, determine approximately how many Indiana's would fit inside Colorado (you don't have to zig-zag in/out of each little section as you measure the area of IN)?
- Create a .jpg (using snipping tool) showing your favorite place .kmz file opened up in SkylineGlobe (use the .kmz from Lab Two - this was question #10 in Lab Two). Note: You need to enter the full path to your .kmz file (like this: https://academics.uccs.edu/bvogt/courses/ges2050/labs/google_earth/kmls/geologic_units_of_colorado.kmz)
- ONE IMAGE: You have included a "snip" (*.jpg) of SkylineGlobe with caption showing your favorite place .kml FROM LAST WEEK'S LAB 2, #10.
From Part Two: Fashion
- STATEMENT:
- Your two-city comparative fashion statement is structured and well-written and discusses/contrasts 'fashion sense' in two metropolitan areas
- FOUR IMAGES:
- Two from each city are displayed on your Lab Three web page, include captions, and are stored in the appropriate folder (your Lab Three images folder)
From Part Three: Virtual Fairfax
- Q/A: Answer the following questions directly on your Lab Three web page (include questions please):
- What color Metro (subway) line would you take to get from Rosslyn, VA to the Pentagon (Note: You might have to use Google Maps or similar to find Rosslyn)?
- What Metro stop lies between Rosslyn, VA and the Pentagon?
- In what state is Washington's Reagan National Airport (DCA)?
- What direction is runway 33 oriented at DCA?
- In which two counties does Dulles International Airport fall?
- How many bridges (of any type) cross from Arlington County, VA into Washington, DC?
- Which Metro Rail Lines (colors) cross from Arlington County, VA into Washington, DC?