One-Sided Limits
Click here for a printable version of this page.In the final two examples in the previous section we saw two limits that did not exist. However, the reason for each of the limits not existing was different for each of the examples.
We saw that \[\lim\limits_{t\to 0}\cos\left(\dfrac\pi t\right)\] did not exist because the function did not settle down to a single value as $t$ approached $t = 0$. The closer to $t=0$ we moved the more wildly the function oscillated and in order for a limit to exist the function must settle down to a single value, as pictured here.
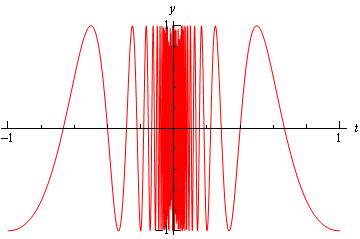
$y=\cos\left(\frac{\pi}{t}\right)$
However, we saw that $\lim\limits_{t\to0} H(t)$, where $$H(t) = \begin{cases} 0 & \text{if } t \lt 0 \\ 1 & \text{if } t \geq 0 \end{cases}$$ did not exist not because the function did not settle down to a single number as we moved in towards $t=0$, but instead because it settled into two different numbers depending on which side of $t=0$ we were on.
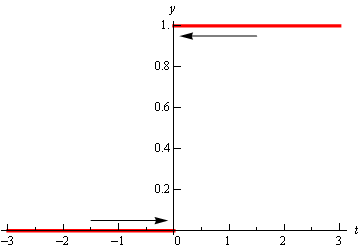
$y=H(t)$
In this case the function was a very well-behaved function, unlike the first function. The only problem was that, as we approached $t=0$, the function was moving in towards different numbers on each side. We would like a way to differentiate between these two examples.
We do this with one-sided limits. As the name implies, with one-sided limits we will only be looking at one side of the point in question. Here are the definitions for the two one sided limits.
Right-sided Limit
We say that \[\lim\limits_{x\to a^+} f(x) = L\] provided we can make $f(x)$ as close to $L$ as we want for all $x$ sufficiently close to $a$ with $x > a$ without actually letting $x$ be $a$.
Here is a graphical example of what this looks like.
When we want to find $\lim\limits_{x\to a^+}f(x)$, we need to "hop onto" the graph of the function on the right side of $x=a$, then travel towards $a$, as indicated by the red arrow. We look at what the height of the function approaches as we travel along the function in this way; that height is $L$, the value of the limit.

Left-sided Limit
We say that \[\lim\limits_{x\to a^-} f(x) = L\] provided we can make $f(x)$ as close to $L$ as we want for all $x$ sufficiently close to $a$ with $x \lt a$ without actually letting $x$ be $a$.
Here is a graphical example of what this looks like.
What we see here is that when we want to find $\lim\limits_{x\to a^-}f(x)$, we need to "hop onto" the graph of the function on the left side of $x=a$, then travel towards $a$, as indicated by the red arrow. We look at what the height of the function approaches as we travel along the function in that manner; that height is $L$, the value of the limit.

Note that the change in notation is very minor and in fact might be missed if you aren’t paying attention. The only difference is the bit that is under the "lim" part of the limit. For the right-sided limit we now have $x \to a^+$ (note the "$+$") which means that we know will only look at $x > a$, that is, $x$ values right of $a$ on the real number line. Likewise, for the left-sided limit we have $x\to a^-$ (note the "$-$") which means that we will only be looking at $x \lt a$, that is, $x$ values left of $a$ on the real number line.


Also, note that as with the one-sided limit (i.e., the limits from the previous section) we still need the function to settle down to a single number in order for the limit to exist. The only difference when we talk about one-sided limits is that the function only needs to settle down to a single number on either the right side of $x = a$ or the left side of $x = a$ depending on the one-sided limit we’re dealing with.
So, when we are looking at limits it’s now important to pay very close attention to see whether we are doing a two-sided limit or one of the one-sided limits. Let’s now take a look at the some of the problems from the last section and look at one-sided limits instead of the two-sided limit.
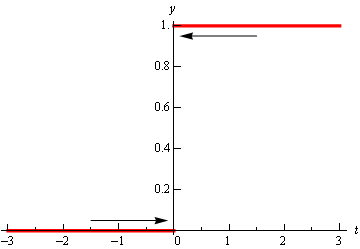
So, we can see that if we stay to the right of $t = 0$, (i.e., $t > 0$), then the output values of the function are all equal to $1$ as $t$ gets closer and closer to $t = 0$ but staying to the right of $t = 0$. We can therefore say that the right-sided limit is \[\lim\limits_{t\to0^+} H(t) = 1.\]
Likewise, if we stay to the left of $t = 0$ (i.e., $t \lt 0$), then the output values of the function ae all equal to $0$ as $t$ gets closer and closer to $t = 0$, but staying to the left of $t = 0$. Therefore, the left-sided limit is, \[\lim\limits_{t\to0^-} H(t) = 0.\]
Notice that the one-sided limits exist even though the two-sided limit doesn't exist.
Here is the graph of this function.

From the graph we can see that both of the one-sided limits suffer the same problem that the two-sided limit did in the previous section. The function does not settle down to a single number on either side of $t = 0$. Therefore, neither the left-sided nor the right-sided limit will exist in this case.
Thus one-sided limits don’t have to exist just as two-sided limits are not guaranteed to exist.
Let’s take a look at another example from the previous section.
Estimate the value of the following limits.
As we’ve done with the previous two examples, let’s remind ourselves of the graph of this function.
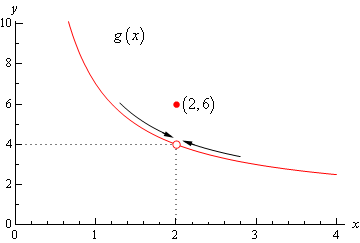
In this case regardless of which side of $x = 2$ we are on the function is always approaching a value of 4 and so we get
Note that one-sided limits do not care about what's happening at the point any more than two-sided limits do. They are still only concerned with what is going on around the point. The only real difference between one-sided limits and two-sided limits is the domain of $x$-values that we look at when determining the value of the limit.
One-sided limits still do not care about what's happening at the point in question.
Now let’s take a look at the first and last example in this section to get a very nice fact about the relationship between one-sided limits and two-sided limits. In the last example the one-sided limits as well as the two-sided limit existed and all three had a value of 4. In the first example the two one-sided limits both existed, but did not have the same value and the two-sided limit did not exist.
The relationship between one-sided limits and two-sided limits can be summarized by the following fact.
Two-sided Limits, or THE Limit of a Function
Given a function $f(x)$, if \[\lim\limits_{x\to a^+}f(x) = \lim\limits_{x\to a^-}f(x) = L \] then the two-sided limit must also exist and \[\lim\limits_{x\to a} f(x) = L\] Likewise, if \[\lim\limits_{x\to a} f(x) = L\] then we know that \[\lim\limits_{x\to a^+}f(x) = \lim\limits_{x\to a^-}f(x) = L \]Conversely, we can say that if the two one-sided limits have different values, i.e., \[\lim\limits_{x\to a^+}f(x) \not= \lim\limits_{x\to a^-}f(x)\] then the two-sided limit will not exist.
This should make some sense. If the two-sided limit did exist then by the fact the two one-sided limits would have to exist and have the same value by the above fact. So, if the two one-sided limits have different values (or don’t even exist) then the two-sided limit simply can’t exist.
Let’s take a look at one more example to make sure that we’ve got all the ideas about limits down that we’ve looked at in the last couple of sections.
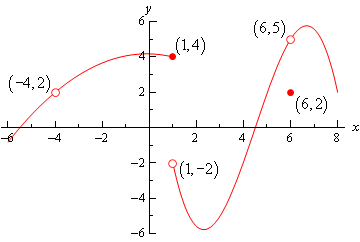
- $f(-4)$
- $\lim\limits_{x\to-4^-}f(x)$
- $\lim\limits_{x\to-4^+}f(x)$
- $\lim\limits_{x\to-4}f(x)$
- $f(1)$
- $\lim\limits_{x\to1^-}f(x)$
- $\lim\limits_{x\to1^+}f(x)$
- $\lim\limits_{x\to1}f(x)$
- $f(6)$
- $\lim\limits_{x\to6^-}f(x)$
- $\lim\limits_{x\to6^+}f(x)$
- $\lim\limits_{x\to6}f(x)$
- $f(-4)$ does not exist. There is no closed dot for this value of $x$, so the function doesn’t exist at this point.
- $\lim\limits_{x\to-4^-}f(x) = 2$. The function is approaching a value of $2$ as $x$ moves in towards $-4$ from the left.
- $\lim\limits_{x\to-4^+}f(x) = 2$. The function is approaching a value of $2$ as $x$ moves in towards $-4$ from the right.
- $\lim\limits_{x\to-4}f(x) = 2$. We can do this two ways. Either we use the fact here that since both one-sided limits exist and are the same, the two-sided limit must exist and have the same value as both one-sided limits. Alternatively, the limit can be seen directly from the graph. Recall that a limit can exist even when there is a hole in the function.
- $f(1) = 4$. The function will take on the $y$ value where the closed dot is.
- $\lim\limits_{x\to1^-}f(x) = 4$. The function is approaching a value of $4$ as $x$ moves in towards $1$ from the left.
- $\lim\limits_{x\to1^+}f(x) = -2$. The function is approaching a value of $-2$ as $x$ moves in towards $1$ from the right. Remember that the limit does NOT care about what the function is actually doing at the point, it only cares about what the function is doing around the point. In this case, always staying to the right of $x=1$, the function is approaching a value of $-2$ and so the limit is $-2$. The limit is not $4$, as that is value of the function at the point and again the limit ignores that point!
- $\lim\limits_{x\to1}f(x)$ doesn’t exist. The two one-sided limits both exist, however they are different and so the two-sided limit doesn’t exist.
- $f(6) = 2$. The function will take on the $y$ value where the closed dot is.
- $\lim\limits_{x\to6^-}f(x) = 5$. The function is approaching a value of $5$ as $x$ moves in towards $6$ from the left.
- $\lim\limits_{x\to6^+}f(x) = 5$. The function is approaching a value of $5$ as $x$ moves in towards $6$ from the right.
- $\lim\limits_{x\to6}f(x) = 5$. Again, we can use either the graph or the one-sided limits to get this. Also, once more remember that the limit ignores what is happening at the point and so it’s possible for the limit to have a different value than the function at a point. When dealing with limits we’ve always got to remember that limits are about the behavior of the function near the point, not directly at the point in question.
Infinite Limits
Sometimes a one-sided or two-sided limit does not exist in a particular way. The function doesn't oscillate wildly as $x$ approaches $a$, but the function keeps growing and growing, as follows:

We will call this an infinite limit.
Infinite Limit
We say that \[\lim\limits_{x\to a^+} f(x) = \infty\] provided we can make $f(x)$ as large as we want for all $x$ sufficiently close to $a$ with $x \gt a$ without actually letting $x$ be $a$.
We say that \[\lim\limits_{x\to a^-} f(x) = \infty\] provided we can make $f(x)$ as large as we want for all $x$ sufficiently close to $a$ with $x \lt a$ without actually letting $x$ be $a$.
We say that \[\lim\limits_{x\to a} f(x) = \infty\] provided we can make $f(x)$ as large as we want for all $x$ sufficiently close to $a$ from either side without actually letting $x$ be $a$.
In each of these cases, the limit does not exist, since the outputs do not approach a single, finite number. Since the outputs grow without bounds, we will use the notation "$= \infty$" to describe the particular way that the limit does not exist.
Similarly, if the limit does not exist in such a way that the function keeps going downwards as $x$ approaches $a$, we will say that the limit is $-\infty$. Such a function is pictured here as $x$ approaches 1 from the left:

Negative Infinite Limit
We say that \[\lim\limits_{x\to a^+} f(x) = -\infty\] provided we can make $f(x)$ as large and negative as we want for all $x$ sufficiently close to $a$ with $x \gt a$ without actually letting $x$ be $a$.
We say that \[\lim\limits_{x\to a^-} f(x) = -\infty\] provided we can make $f(x)$ as large and negative as we want for all $x$ sufficiently close to $a$ with $x \lt a$ without actually letting $x$ be $a$.
We say that \[\lim\limits_{x\to a} f(x) = -\infty\] provided we can make $f(x)$ as large and negative as we want for all $x$ sufficiently close to $a$ from either side without actually letting $x$ be $a$.
In each of these cases, the limit does not exist, since the outputs do not approach a single, finite number. Since the outputs grow without bounds in the negative direction, we will use the notation "$= -\infty$" to describe the particular way that the limit does not exist.
Let's check out an example or two.

To evaluate $\lim\limits_{x\to -2^-}f(x)$, we need to hop onto the function on the left side of -2, then travel towards -2, like this:
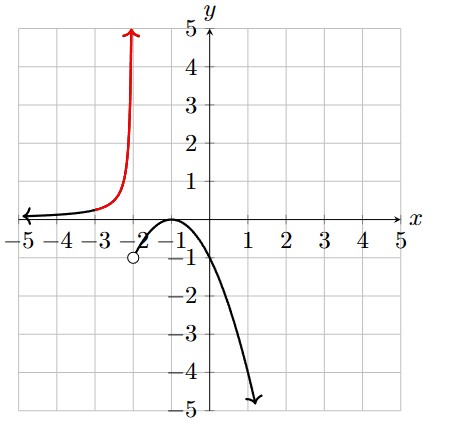
We can see the height just keeps increasing, so technically the limit does not exist. It doesn't exist in the specific way that the height increases without bound, as $x$ gets very close to -2 and $x \lt -2$. Therefore we say, $\lim\limits_{x\to -2^-}f(x) = \infty$.
For $\lim\limits_{x\to -2^+}f(x)$ we need to hop onto the function on the right side of -2, then travel towards -2, like this:
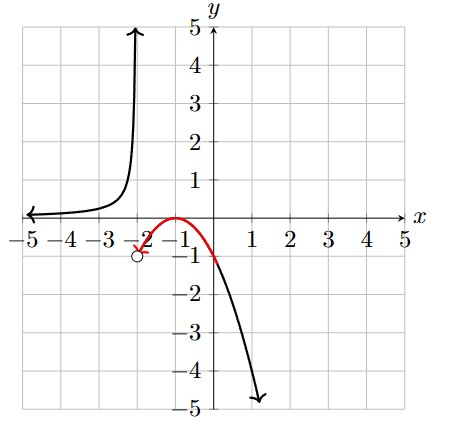
On this side, then, the height of the function approaches the location of that open circle. Therefore, $\lim\limits_{x\to -2^+}f(x)=-1$.
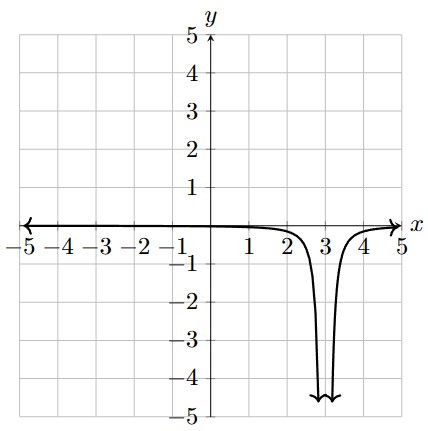
To evaluate $\lim_{x\to 3^-}f(x)$, we need to hop onto the function on the left side of 3, then travel towards 3, like this:

We can see the height just keeps decreasing, without bound, so the limit does not exist. Since this limit doesn't exist in such a way that the height decreases without bound as $x$ gets very close to 3 and $x \lt 3$, we can say $\lim\limits_{x\to 3^-}f(x) = -\infty$.
For $\lim\limits_{x\to 3^+}f(x)$ we need to hop onto the function on the right side of 3, then travel towards 3, like this:

On this side, then, the height of the function also keeps decreasing, without bound, as $x$ gets very close to 3 and $x \gt 3$. Therefore, the limit does not exist, but we can say more specifically $\lim\limits_{x\to 3^+}f(x) = -\infty$.
Limits at Infinity
Now we have a way of indicating when the height (y-value) of our function grows without bound. We can also investigate limits where we let $x$ grow without bound. This is a different way of notating end behavior, which you may or may not remember from a before-calculus course. We can have any of the folowing situations:
Limits at Infinity
We say that $\lim\limits_{x\to \infty}f(x) = L$ provided we can make $f(x)$ as close to L as we want for all sufficiently large $x$-values.
We say that $\lim\limits_{x\to \infty}f(x) = \infty$ provided we can make $f(x)$ as large as we want for all sufficiently large $x$-values.
We say that $\lim\limits_{x\to \infty}f(x) = -\infty$ provided we can make $f(x)$ negative and as large as we want for all sufficiently large $x$-values.
When we try to calculate a limit at infinity, we look at the behavior of the graph of $f(x)$ on the extreme right hand side. If the height gets closer and closer to $L$, we say $\lim\limits_{x\to \infty}f(x) = L$. If the height goes up without bound on the extreme right side, we say $\lim\limits_{x\to \infty}f(x) = \infty$. If the height goes down without bound on the extreme right side, we say $\lim\limits_{x\to \infty}f(x) = -\infty$.
Similarly, we can calculate limits at negative infinity as follows.
Limits at Negative Infinity
We say that $\lim\limits_{x\to -\infty}f(x) = L$ provided we can make $f(x)$ as close to L as we want for all sufficiently large and negative $x$-values.
We say that $\lim\limits_{x\to -\infty}f(x) = \infty$ provided we can make $f(x)$ as large as we want for all sufficiently large and negative $x$-values.
We say that $\lim\limits_{x\to -\infty}f(x) = -\infty$ provided we can make $f(x)$ negative and as large as we want for all sufficiently large and negative $x$-values.
Time to check out some examples.
To evaluate $\lim\limits_{x\to -\infty}f(x)$, we need to look at the height on the extreme left side of the graph:

We can see the height gets very close to 0 as $x$ gets larger and negative. Therefore, $\lim\limits_{x\to-\infty}f(x) = 0$.
For $\lim\limits_{x\to \infty}f(x)$ we need look at the height on the extreme right side of the graph:

On this side, then, the height of the function goes down without bound. Therefore, $\lim\limits_{x\to \infty}f(x)=-\infty$.
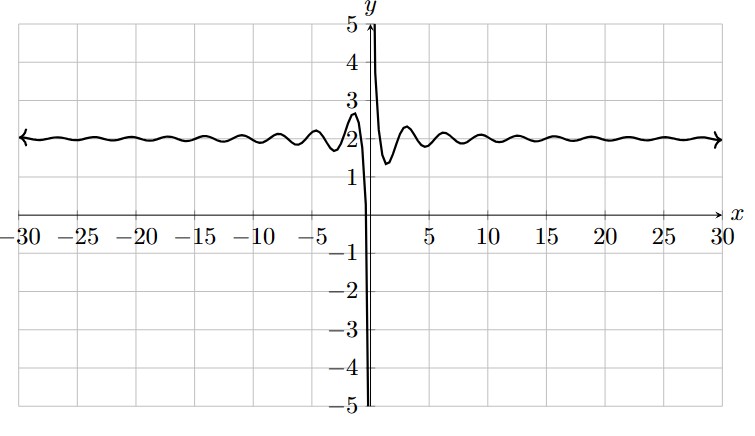
To evaluate $\lim\limits_{x\to -\infty}f(x)$, we need to look at the height on the extreme left side of the graph:
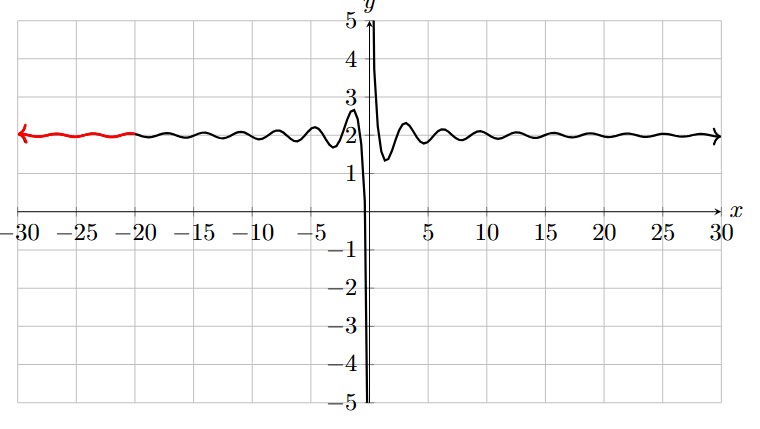
Though the height is oscillating, we can see it is getting very close to a height of 2, so we say that $\lim\limits_{x\to -\infty}f(x) = 2$.
For $\lim\limits_{x\to \infty}f(x)$ we need look at the height on the extreme right side of the graph:

Again, the height is oscillating, but we can see it is getting very close to a height of 2, so we say that $\lim\limits_{x\to -\infty}f(x) = 2$.
Hopefully over the last couple of sections you’ve gotten an idea on how limits work and what they can tell us about functions. Some of these ideas will be important in later sections so it’s important that you have a good grasp on them.
Practice Problems
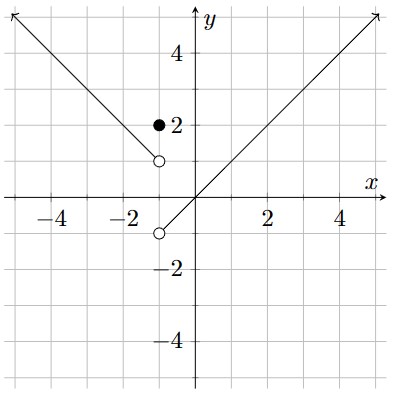
- The graph of $f(x)$ is below. Find each of the indicated limits.
- Find $\lim\limits_{x\to-1^-}f(x)$
- Find $\lim\limits_{x\to-1^+}f(x)$
- Find $\lim\limits_{x\to-1}f(x)$
- Find $f(-1)$
- Find $\lim\limits_{x\to-\infty}f(x)$
- Find $\lim\limits_{x\to\infty}f(x)$
- For $\lim\limits_{x\to-1^-}f(x)$, we want to hop onto the function on the left side of -1 and travel towards -1, like this:
- For $\lim\limits_{x\to-1^+}f(x)$, we want to hop onto the function on the right side of -1 and travel towards -1, like this:
- Since $\lim\limits_{x\to-1^-}f(x) \neq \lim\limits_{x\to-1^+}f(x)$, we must conclude that $\lim\limits_{x\to-1}f(x)$ does not exist.
- The value of $f(-1)$ occurs at the closed dot where $x=-1$. That dot has height 2, so $f(-1) = 2$.
- To find $\lim\limits_{x\to-\infty}f(x)$, we look at the height of the function on the extreme left side of the graph, where our $x$-values are very large and negative.
- To find $\lim\limits_{x\to\infty}f(x)$, we look at the height of the function on the extreme right side of the graph, where our $x$-values are very large and positive.
- The graph of $f(x)$ is below. Find each of the indicated limits.
- Find $\lim\limits_{x\to1^-}f(x)$
- Find $\lim\limits_{x\to1^+}f(x)$
- Find $\lim\limits_{x\to1}f(x)$
- Find $f(1)$
- Find $\lim\limits_{x\to-\infty}f(x)$
- Find $\lim\limits_{x\to \infty}f(x)$
- For $\lim\limits_{x\to 1^-}f(x)$, we want to hop onto the function on the left side of 1 and travel towards 1, like this:
- For $\lim\limits_{x\to1^+}f(x)$, we want to hop onto the function on the right side of 1 and travel towards 1, like this:
- Since $2=\lim\limits_{x\to-1^-}f(x) = \lim\limits_{x\to-1^+}f(x)=2$, we can conclude that $\lim\limits_{x\to1}f(x)=2$.
- The value of $f(1)$ occurs at the closed dot where $x=1$. That dot has height 4, so $f(1) = 4$.
- To find $\lim\limits_{x\to-\infty}f(x)$, we look at the height of the function on the extreme left side of the graph, where our $x$-values are very large and negative.
- To find $\lim\limits_{x\to\infty}f(x)$, we look at the height of the function on the extreme right side of the graph, where our $x$-values are very large and positive.
- The graph of $f(x)$ is below.
- Find $\lim\limits_{x\to2^-}f(x)$
- Find $\lim\limits_{x\to2^+}f(x)$
- Find $\lim\limits_{x\to2}f(x)$
- Find $f(2)$
- Find $\lim\limits_{x\to-\infty}f(x)$
- Find $\lim\limits_{x\to\infty}f(x)$
- For $\lim\limits_{x\to 2^-}f(x)$, we want to hop onto the function on the left side of 2 and travel towards 2, like this:
- For $\lim\limits_{x\to2^+}f(x)$, we want to hop onto the function on the right side of 2 and travel towards 2, like this:
- Since $\lim\limits_{x\to2^-}f(x) \neq \lim\limits_{x\to2^+}f(x)$, we conclude that $\lim\limits_{x\to 2}f(x)$ does not exist.
- The value of $f(2)$ occurs at the closed dot where $x=2$. That dot has height -3, so $f(2) = -3$.
- To find $\lim\limits_{x\to-\infty}f(x)$, we look at the height of the function on the extreme left side of the graph, where our $x$-values are very large and negative.
- To find $\lim\limits_{x\to\infty}f(x)$, we look at the height of the function on the extreme right side of the graph, where our $x$-values are very large and positive.
- Below is the graph of $f(x)$. For each of the given points, determine the value of $f(a)$, $\lim\limits_{x\to a^-}f(x)$, $\lim\limits_{x\to a^+}f(x)$, and $\lim\limits_{x\to a}f(x)$. If any of the quantities do not exist, clearly explain why.
- $a=-2$
- $a=1$
- $a=3$
- $a=5$
- $a= -2$
- $a=1$
- $a=3$
- $a=5$
- Sketch a graph of a function that satisfies all of the following conditions. $$\lim_{x\to2^-}f(x) = 1~~~~~\lim_{x\to2^+}f(x) = -4~~~~~f(2)=1$$ $$\lim_{x\to\infty}f(x)=\infty~~~~~\lim_{x\to-\infty}f(x)=-\infty$$
- Sketch a graph of a function that satisfies all of the following conditions. $$\lim\limits_{x\to-1}f(x) = -3~~~~~f(-1)=2$$ $$\lim_{x\to\infty}f(x)=-\infty~~~~~\lim_{x\to-\infty}f(x)=2$$
- Sketch a graph of a function that satisfies all of the following conditions. $$\lim\limits_{x\to3^-}f(x) = 0~~~~~\lim\limits_{x\to3^+}f(x) = \infty$$ $$f(3)~\text{does not exist}$$
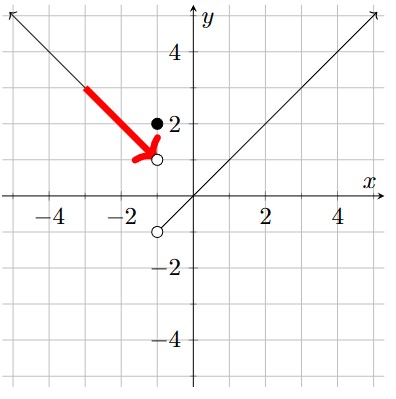
We see that the height gets very close to 1, so $\lim\limits_{x\to-1^-}f(x) =1$.
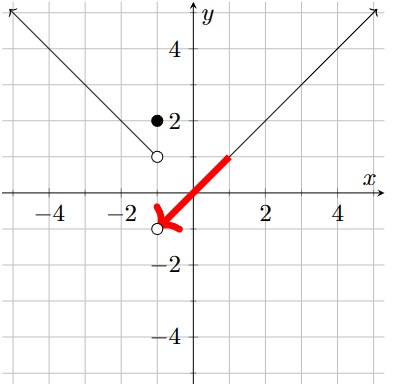
On this side, the height of the function gets very close to -1, so $\lim\limits_{x\to-1^+}f(x)=-1$.
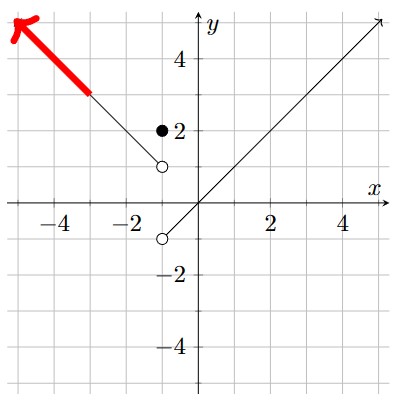
On the left side, the limit does not exist because the height of the function increases without bound, so we say that $\lim\limits_{x\to-\infty}f(x)=\infty$.
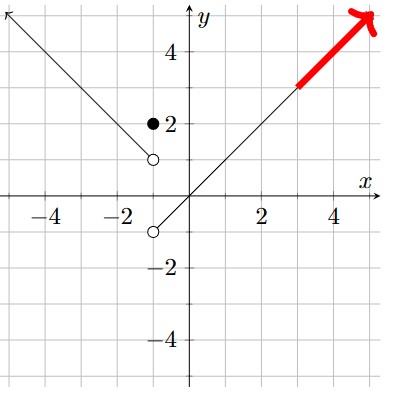
On the right side, the limit does not exist because the height of the function increases without bound, so we say that $\lim\limits_{x\to\infty}f(x)=\infty$.
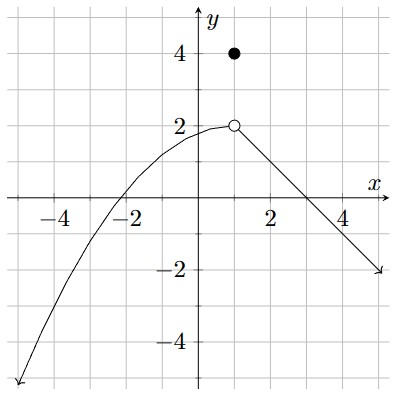
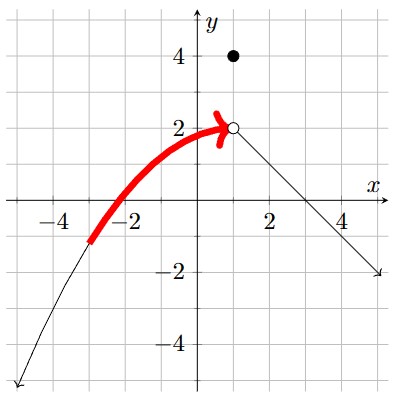
We see that the height gets very close to 2, so $\lim\limits_{x\to1^-}f(x) =2$.
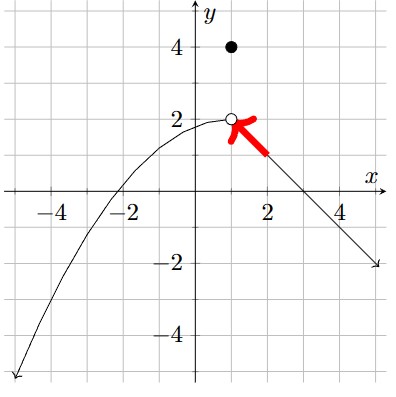
On this side, the height of the function gets very close to 2, so $\lim\limits_{x\to1^+}f(x)=2$.
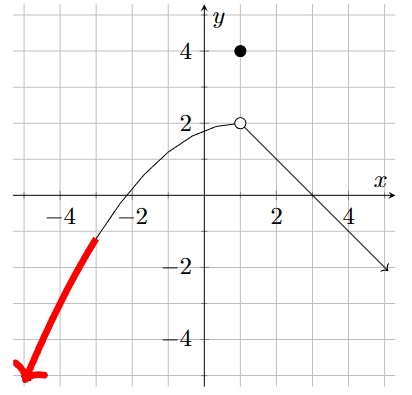
On the left side, the limit does not exist because the height of the function decreases without bound, so we say that $\lim\limits_{x\to-\infty}f(x)=-\infty$.
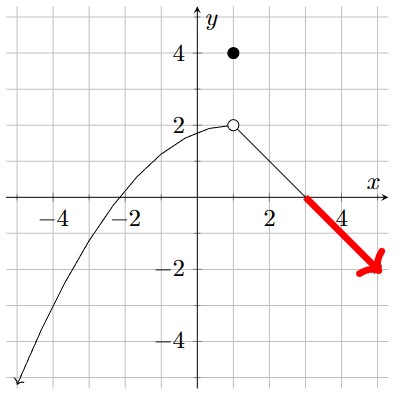
On the right side, the limit does not exist because the height of the function decreases without bound, so we say that $\lim\limits_{x\to\infty}f(x)=-\infty$.

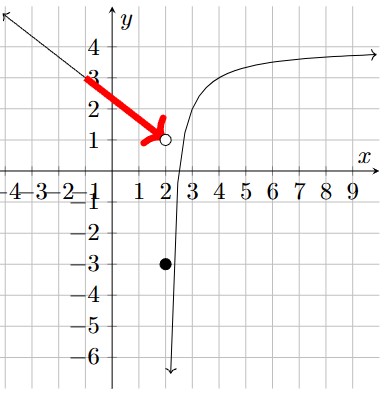
We see that the height gets very close to 1, so $\lim\limits_{x\to2^-}f(x) =1$.
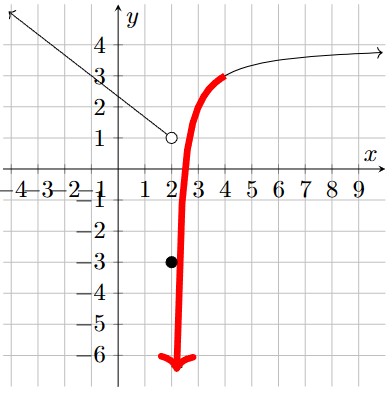
On this side, the limit does not exist because the height of the function decreases without bound; that is, the y-values become very large and negative. Therefore, we say that $\lim\limits_{x\to2^+}f(x) = -\infty.$
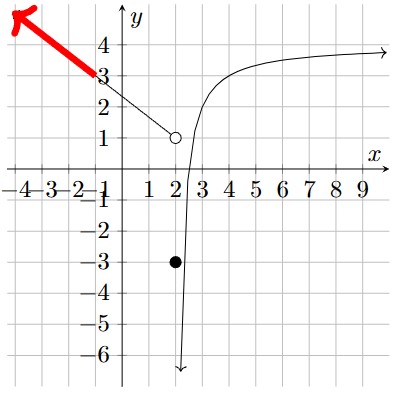
On the left side, the limit does not exist because the height of the function increases without bound, so we say that $\lim\limits_{x\to-\infty}f(x)=\infty$.
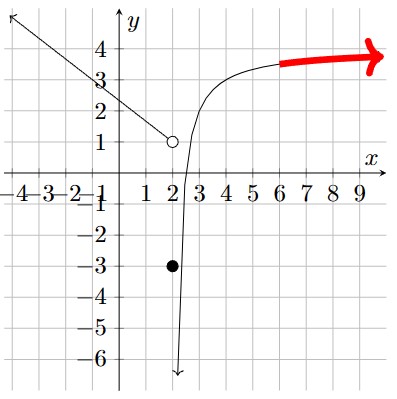
On the right side, the height of the function is getting closer and closer to 4 as x gets larger and larger, so we say that $\lim\limits_{x\to\infty}f(x)=4$.
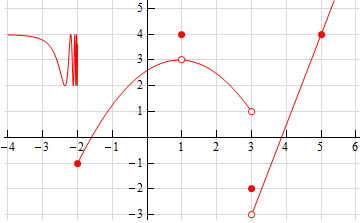
From the graph we can see that $f(-2) = -1$, because the closed dot is at the height $y=-1$.
We can also see that as we approach $x=-2$ from the left, the graph is not approaching a single value, but instead oscillating wildly, and as we approach from the right the graph is approaching a value of -1. Therefore, we get, $$\lim_{x\to-2^-}f(x) ~ \text{does not exist, }~~~~\text{&}~\lim_{x\to-2^+}f(x) = -1.$$
Recall that in order for limit to exist the function must be approaching a single value and so, in this case, because the graph to the left of $x=-2$ is not approaching a single value the left-hand limit will not exist. This does not mean that the right-hand limit will not exist. In this case the graph to the right of $x=-2$ is approaching a single value, thus the right-hand limit will exist.
Now, because the two one-sided limits are different we know that, $$\lim\limits_{x\to-2}f(x)\text{ does not exist}.$$
From the graph we can see that $f(1)=4$, because the closed dot is at the height $y=4$.
We can also see that as we approach $x=1$ from both sides the graph is approaching the same value, 3, and so we get, $$\lim_{x\to1^-}f(x) = 3 ~~~\text{&}~~~\lim_{x\to1^+}f(x) = 3.$$
The two one-sided limits are the same so we know, $$\lim_{x\to1}f(x) = 3.$$
From the graph we can see that $f(3)=-2$, because the closed dot is at the height $y=-2$.
We can also see that as we approach $x=2$ from the left the graph is approaching 1, and as we approach from the right the height of the graph is approaching a value of -3, and so we get, $$\lim_{x\to3^-}f(x) = 1 ~~~\text{&}~~~\lim_{x\to3^+}f(x) = -3.$$
Now, because the two one-sided limits are different we know that, $$\lim_{x\to3}f(x) ~\text{does not exist}.$$
From the graph we can see that $f(5)=4$, because the closed dot is at the height $y=4$.
We can also see that as we approach $x=5$ from both sides the graph is approaching the same value, 4, and so we get, $$\lim_{x\to5^-}f(x) = 4 ~~~\text{&}~~~\lim_{x\to5^+}f(x) = 4.$$
The two one-sided limits are the same so we know, $$\lim_{x\to5}f(x) = 4.$$
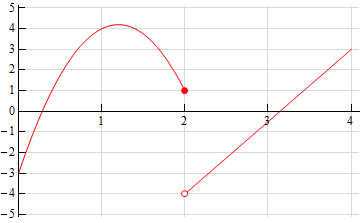
There are literally an infinite number of possible graphs that we could give here for an answer. However, all of them must have a closed dot on the graph at the point $(2,1)$, the graph must be approaching a height of 1 as it approaches $x=2$ from the left (as indicated by the left-hand limit) and it must be approaching a height of -4 as it approaches $x=2$ from the right (as indicated by the right-hand limit). Furthermore, on the extreme right side, the height must increase without bound (as indicated by the limit as $x\to\infty$), and on the extreme left side, the height must decrease without bound (as indicated by the limit as $x \to-\infty$).
Here is a sketch of one possible graph that meets these conditions.
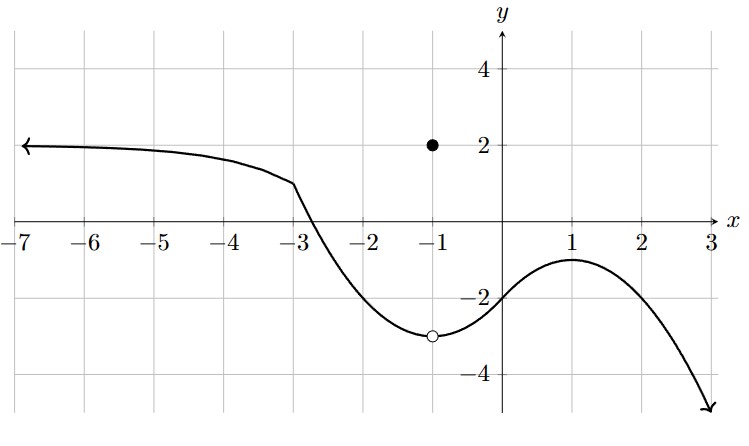
There are literally an infinite number of possible graphs that we could give here for an answer. However, all of them must have a open dot on the graph at the point $(-1,-3)$, because the limit at $x=-1$ must be -3; but $f(-1) = 2$, so there must be a closed dot at $(-1,2)$. Furthermore, on the extreme right side, the height must decrease without bound (as indicated by the limit as $x\to\infty$), and on the extreme left side, the height must get closer and closer to 2 (as indicated by the limit as $x\to-\infty$.
Here is a sketch of one possible graph that meets these conditions.
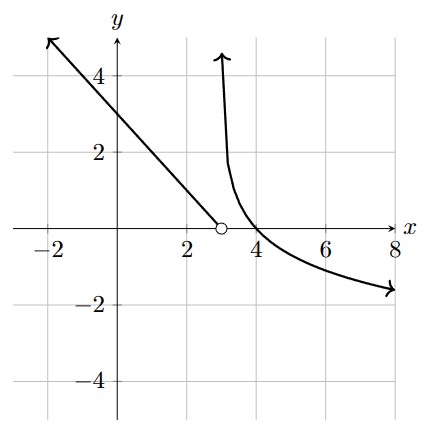
There are literally an infinite number of possible graphs that we could give here for an answer. However, all of them must have a open dot on the graph at the point $(3,0)$, because the limit at $x=3$ from the left must be 0, but $f(3)$ itself does not exist. Also, as $x$ approaches 3 from the right, the height of the graph must go up without bound.
Here is a sketch of one possible graph that meets these conditions.
Assignment Problems
- Below is the graph of $f(x)$. For each of the given points in a-d, determine the value of $f(a)$, $\lim\limits_{x\to a^-}f(x)$, $\lim\limits_{x\to a^+}f(x)$, and $\lim\limits_{x\to a}f(x)$. If any of the quantities do not exist, clearly explain why.
- $a=-5$
- $a=-2$
- $a=1$
- $a=4$
- Find $\lim\limits_{x\to\infty}$.
- Find $\lim\limits_{x\to-\infty}$.
- Below is the graph of $f(x)$. For each of the given points in a-c, determine the value of $f(a)$, $\lim\limits_{x\to a^-}f(x)$, $\lim\limits_{x\to a^+}f(x)$, and $\lim\limits_{x\to a}f(x)$. If any of the quantities do not exist, clearly explain why.
- $a=-1$
- $a=1$
- $a=3$
- Find $\lim\limits_{x\to\infty}$.
- Find $\lim\limits_{x\to-\infty}$.
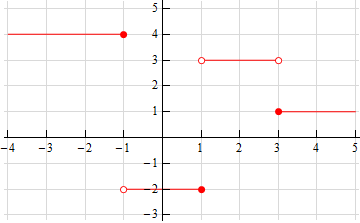
- Below is the graph of $f(x)$. For each of the given points in a-d, determine the value of $f(a)$, $\lim\limits_{x\to a^-}f(x)$, $\lim\limits_{x\to a^+}f(x)$, and $\lim\limits_{x\to a}f(x)$. If any of the quantities do not exist, clearly explain why.
- $a=-3$
- $a=-1$
- $a=1$
- $a=2$
- Find $\lim\limits_{x\to\infty}$.
- Find $\lim\limits_{x\to-\infty}$.
- Sketch a graph of a function that satisfies each of the following conditions. $$\lim_{x\to1^-}f(x) = -2~~~~~\lim_{x\to1^+}f(x)=3~~~~~f(1)=6$$ $$\lim_{x\to\infty}f(x)=4~~~~~\lim_{x\to-\infty}f(x)=4$$
- Sketch a graph of a function that satisfies each of the following conditions. $$\lim_{x\to-3^-}f(x) = 1~~~~~\lim_{x\to-3^+}f(x)=1~~~~~f(-3)=4$$ $$\lim_{x\to\infty}f(x)=-\infty~~~~~\lim_{x\to-\infty}f(x)=-\infty$$
- Sketch a graph of a function that satisfies each of the following conditions. $$\lim_{x\to-5^-}f(x) = -\infty~~~~~\lim_{x\to-5^+}f(x)=7~~~~~f(-5)=4$$ $$\lim_{x\to4}f(x)=6~~~~~f(4)\text{ does not exist}$$
- Explain in your own words what each of the following equations mean. $$\lim\limits_{x\to8^-}f(x) = 3~~~~~\lim\limits_{x\to8^+}f(x)=-1$$
- Suppose we know that $\lim\limits_{x\to-7}f(x)=18$. If possible, determine the value of $\lim\limits_{x\to-7^-}f(x)=18$ and the value of $\lim\limits_{x\to-7^+}f(x)=18$. If it is not possible to determine one or both of these values explain why not.
- Suppose we know that $f(6)=-53$. If possible, determine the value of $\lim\limits_{x\to6^-}f(x)$ and the value of $\lim\limits_{x\to6^+}f(x)$. If it is not possible to determine one or both of these values explain why not.


Note: The following content is adapted from OpenStax and is licensed under a Creative Commons Attribution-NonCommercial-ShareAlike 4.0 International License.
Access for free at OpenStax.
In the following exercises, sketch the graph of a function with the given properties.
- $\lim\limits_{x\to2}f(x) = 1$,$ \lim\limits_{x\to 4^-} f(x) = 3$,$ \lim\limits_{x\to 4^+} f(x) = 6$,$ f(4)$ does not exist.
- $\lim\limits_{x\to-\infty}f(x) = 0$,$ \lim\limits_{x\to-1^-}f(x) = -\infty$,$ \lim\limits_{x\to1^+}f(x) = \infty$,$ \lim\limits_{x\to0}f(x) = f(0)$,$ f(0)=1$,$ \lim\limits_{x\to\infty}f(x) = -\infty$
- $\lim\limits_{x\to-\infty}f(x) = 2$,$ \lim\limits_{x\to-2}f(x) = -\infty$,$ \lim\limits_{x\to\infty}f(x) = 2$,$ f(0)=0$
- $\lim\limits_{x\to-\infty}f(x) = 0$,$ \lim\limits_{x\to-1^-}f(x) = \infty$,$ \lim\limits_{x\to-1^+}f(x) = -\infty$,$ f(0)=-1$,$ \lim\limits_{x\to1^-}f(x) = -\infty$,$ \lim\limits_{x\to1^+}f(x) = \infty$,$ \lim\limits_{x\to\infty}f(x) = 0$
- Shock waves arise in many physical applications, ranging from supernovas to detonation waves. A graph of the density of a shock wave with respect to distance, $x$, is shown here. We are mainly interested in the location of the front of the shock, labeled $x_{SF}$ in the diagram.
- $\lim\limits_{x\to x_{SF}^-}\rho(x)$
- $\lim\limits_{x\to x_{SF}^+}\rho(x)$
- $\lim\limits_{x\to x_{SF}}\rho(x)$
- If $\lim\limits_{x\to a}f(x)$ exists, then $f(a)$ must exist.
- It is possible for $\lim\limits_{x\to a}f(x)$ to not exist, but $f(a)$ to equal some number.
- $\lim\limits_{x\to a}f(x) = L$ means that if $x_1$ is closer to $a$ than $x_1$ is, then $f(x_1)$ will be closer to $L$ than $f(x_2)$ is.
- If $\lim\limits_{x\to a}f(x) = \infty$, then $f(a)$ is equal to a very large number.
- If $\lim\limits_{x\to a}f(x)$ exists, then both $\lim\limits_{x\to a^-}f(x)$ and $\lim\limits_{x\to a^+}f(x)$ must exist.
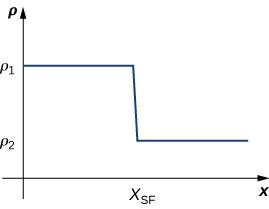
Evaluate each of the following limits and explain the physical meanings behind your answers.
Indicate whether the following statements are true or false. Justify your answers.