Section 1.2 Domain and Range
One of our main goals in mathematics is to model the real world with mathematical functions. In doing so, it is important to keep in mind the limitations of those models we create.
This table shows a relationship between circumference and height of a tree as it grows.
| Circumference, c | 1.7 | 2.5 | 5.5 | 8.2 | 13.7 |
|---|---|---|---|---|---|
| Height, h | 24.5 | 31 | 45.2 | 54.6 | 92.1 |
While there is a strong relationship between the two, it would certainly be ridiculous to talk about a tree with a circumference of -3 feet, or a height of 3000 feet. When we identify limitations on the inputs and outputs of a function, we are determining the domain and range of the function.
Domain and Range
Domain: The set of possible input values to a function
Range: The set of possible output values of a function
Using the tree table above, determine a reasonable domain and range.
We could combine the data provided with our own experiences and reason to approximate the domain and range of the function $h = f(c).$ For the domain, possible values for the input circumference c, it doesn’t make sense to have negative values, so $c\gt 0$. We could make an educated guess at a maximum reasonable value, or look up that the maximum circumference measured is about 119 feet1. With this information, we would say a reasonable domain is $0\lt c \leq 119$ feet.
Similarly for the range, it doesn’t make sense to have negative heights, and the maximum height of a tree could be looked up to be 379 feet, so a reasonable range is $0\lt h \leq 379 $ feet.
When sending a letter through the United States Postal Service, the price depends upon the weight of the letter2, as shown in the table below. Determine the domain and range.
| Letters | |
|---|---|
| Weight not Over | Price |
| 1 ounce | $0.58 |
| 2 ounces | $0.78 |
| 3 ounces | $0.98 |
| 3.5 ounces | $1.18 |
Suppose we notate Weight by w and Price by p, and set up a function named P, where Price, p is a function of Weight, w. $p = P(w).$
Since acceptable weights are 3.5 ounces or less, and negative weights don’t make sense, the domain would be $0\lt w \leq 3.5$. Technically 0 could be included in the domain, but logically it would mean we are mailing nothing, so it doesn’t hurt to leave it out.
Since possible prices are from a limited set of values, we can only define the range of this function by listing the possible values. The range is $p = \$0.58, \$0.78, \$0.98$, or $\$1.18$.
The population of a small town in the year 1960 was 100 people. Since then, the population has grown to 1400 people reported during the 2010 census. Choose descriptive variables for your input and output and use interval notation to write the domain and range.
Notation
In the previous examples, we used inequalities to describe the domain and range of the functions. This is one way to describe intervals of input and output values, but is not the only way. Let us take a moment to discuss notation for domain and range.
Using inequalities, such as $0\lt c \leq 163$, $0\lt w \leq 3.5$, and $0\lt h \leq 379$ imply that we are interested in all values between the low and high values, including the high values in these examples.
However, occasionally we are interested in a specific list of numbers like the range for the price to send letters, $p = $0.58, $0.78, $0.98, or $1.18$. These numbers represent a set of specific values: $\{0.58, 0.78, 0.98, 1.18\}.$
Representing values as a set, or giving instructions on how a set is built, leads us to another type of notation to describe the domain and range.
Suppose we want to describe the values for a variable x that are 10 or greater, but less than 30. In inequalities, we would write $10 \leq x\lt 30$.
When describing domains and ranges, we sometimes extend this into set-builder notation, which would look like this: $\{x|10\leq x\lt30\}$. The curly brackets {} are read as “the set of”, and the vertical bar | is read as “such that”, so altogether we would read $\{x|10\leq x\lt30\}$ as “the set of x-values such that 10 is less than or equal to x and x is less than 30.”
When describing ranges in set-builder notation, we could similarly write something like $\{f(x)|0\lt f(x)\lt 100\}$, or if the output had its own variable, we could use it. So for our tree height example above, we could write for the range $\{h|0\lt h \leq 379\}$. In set-builder notation, if a domain or range is not limited, we could write $\{t|t \text{ is a real number}\}$, or $\{t|t \in \mathbf{R} \}$, read as “the set of t-values such that t is an element of the set of real numbers.
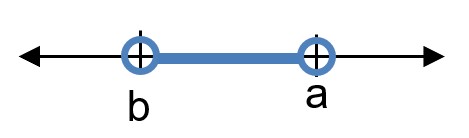
A more compact alternative to set-builder notation is interval notation, in which intervals of values are referred to by the starting and ending values. Curved parentheses are used for “strictly less than,” and square brackets are used for “less than or equal to.” Since infinity is not a number, we can’t include it in the interval, so we always use curved parentheses with $\infty$ and $-\infty$. The table below will help you see how inequalities correspond to set-builder notation and interval notation:
| Inequality | Picture | Set Builder Notation | Interval notation |
|---|---|---|---|
| $x \gt b$ | 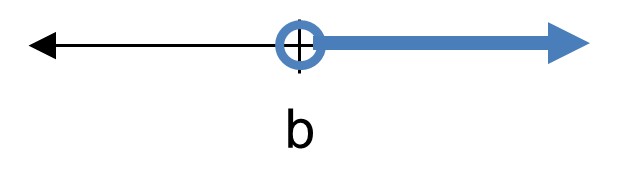 |
$\{x|x \gt b\}$ | $(b, \infty)$ |
| $x \geq b$ | 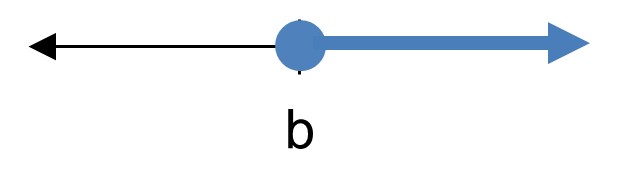 |
$\{x|x \geq b\}$ | $[b, \infty)$ |
| $x\lt a$ |  |
$\{x|x\lt a\}$ | $(−\infty,a)$ |
| $x \leq a$ | 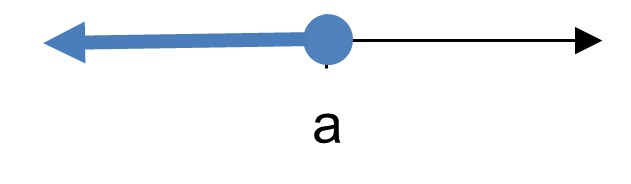 |
$\{x|x \leq a\}$ | $( −\infty, a]$ |
| $b\lt x\lt a$ |
|
$\{x|b\lt x\lt a\}$ | $(b,a)$ |
| $b \leq x\lt a$ | 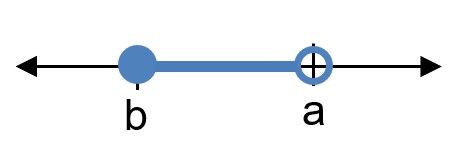 |
$\{x|b \leq x\lt a\}$ | $[b, a)$ |
| $b\lt x \leq a$ | 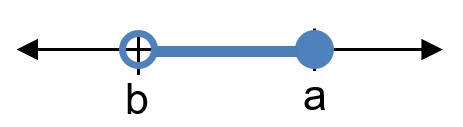 |
$\{x|b\lt x \leq a\}$ | $(b, a]$ |
| $b \leq x \leq a$ |  |
$\{x|b \leq x \leq a\}$ | $[b, a]$ |
To combine two intervals together, using inequalities or set-builder notation we can use the word “or”. In interval notation, we use the union symbol, $⋃$ , to combine two unconnected intervals together.
Describe the intervals of values shown on the line graph below using set builder and interval notations.

To describe the values, x, that lie in the intervals shown above we would say, “x is a real number greater than or equal to 1 and less than or equal to 3, or a real number greater than 5.”
As an inequality it is: $1 \leq x \leq 3$ or $x \gt 5$
In set builder notation:$\{x|1 \leq x \leq 3$ or $x \gt 5\}$
In interval notation: $[1, 3] ∪ (5,\infty)$
Remember when writing or reading interval notation:
Brackets vs. Parenthesis in Interval Notation
Using a square bracket [ means the start value is included in the set.
Using a parenthesis ( means the start value is not included in the set.
Given the following interval, write its meaning in words, set builder notation, and interval notation.

Domain and Range from Graphs
We can also talk about domain and range based on graphs. Since domain refers to the set of possible input values, the domain of a graph consists of all the input values shown on the graph. Remember that input values are almost always shown along the horizontal axis of the graph. Likewise, since range is the set of possible output values, the range of a graph we can see from the possible values along the vertical axis of the graph.
Be careful – if the graph continues beyond the window on which we can see the graph, the domain and range might be larger than the values we can see.
Determine the domain and range of the graph below.
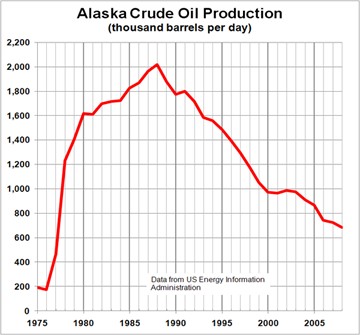
In the graph above3, the input quantity along the horizontal axis appears to be “year”, which we could notate with the variable y. The output is “thousands of barrels of oil per day”, which we might notate with the variable b, for barrels. The graph would likely continue to the left and right beyond what is shown, but based on the portion of the graph that is shown to us, we can determine the domain is $1975 \leq y \leq 2008$, and the range is approximately $180 \leq b \leq 2010$.
In interval notation, the domain would be [1975, 2008] and the range would be about [180, 2010]. For the range, we have to approximate the smallest and largest outputs since they don’t fall exactly on the grid lines.
Remember that, as in the previous example, x and y are not always the input and output variables. Using descriptive variables is an important tool to remembering the context of the problem.
Determine the domain and range of the graph below.

For the domain, we want to list all the possible $x$-values from left to right. We’ll use interval notation here. Notice that there is a break in the middle of the graph:

So the function is using $x$-values from the far left up to -3 (with a closed dot), and from -1 (with an open dot) to the far right. That makes the domain $( − \infty, − 3]⋃(−1,\infty)$.
For the range, we want to list all possible $y$-values from bottom to top. Again, there’s a break in the graph:

The function uses $y$-values from the bottom up to -1 (with a closed dot), then from 1 (with an implied closed dot) to the top. That makes the range $(−\infty,−1]\bigcup[1,\infty)$.
Given the graph below write the domain and range in interval notation

Piecewise Functions
From your previous studies, you may be familiar with the absolute value function $f(x) = |x|$. Students tend to this of this function as the one that makes things positive.
With a domain of all real numbers and a range of values greater than or equal to 0, the absolute value can be defined as the magnitude or modulus of a number, a real number value regardless of sign, the size of the number, or the distance from 0 on the number line. All of these definitions require the output to be greater than or equal to 0.
If we input 0, or a positive value the output is unchanged (stays positive)
$f(x) = x$ if $x \geq 0$
If we input a negative value the sign must change from negative to positive.
$f(x) = − x$ if $x\lt 0$, since multiplying a negative value by -1 makes it positive.
Since this requires two different processes or pieces, the absolute value function is often called the most basic piecewise defined function.
A piecewise function is a function in which the formula used depends upon the domain the input lies in. We notate this idea like:
$$f(x) = \left\{ \begin{matrix} \text{formula 1} & \text{if} & \text{domain to use formula 1} \\ \text{formula 2} & \text{if} & \text{domain to use formula 2} \\ \text{formula 3} & \text{if} & \text{domain to use formula 3} \end{matrix} \right.\ $$
A museum charges \$5 per person for a guided tour with a group of 1 to 9 people, or a fixed \$50 fee for 10 or more people in the group. Set up a function relating the number of people, n, to the cost, C.
To set up this function, two different formulas would be needed. $C = 5n$ would work for n values under 10, and $C = 50$ would work for values of n ten or greater. Notating this:
$$C(n) = \begin{cases} 5n, & \text{if } & 0 \lt n \lt 10 \\ 50, & \text{if} & n \geq 10 \end{cases}$$
A prepaid cell phone company uses the function below to determine the cost, C, in dollars for g gigabytes of data transfer.
$C(g) = \left\{ \begin{matrix} 25 & \text{if} & 0 \lt g \lt 2 \\ 25 + 10(g - 2) & \text{if} & g \geq 2 \end{matrix} \right.\ $
Find the cost of using 1.5 gigabytes of data, and the cost of using 4 gigabytes of data.
To find the cost of using 1.5 gigabytes of data, $C(1.5)$, we first look to see which piece of domain our input falls in. Since 1.5 is less than 2, we use the first formula, giving $C(1.5) =$ \$25.
The find the cost of using 4 gigabytes of data, $C(4),$ we see that our input of 4 is greater than 2, so we’ll use the second formula. $C(4) = 25 + 10(4−2) =$ \$45.
Sketch a graph of the function
$$f(x) = \left\{ \begin{matrix} x^{2} & \text{if} & x \leq 1 \\ 3 & \text{if} & 1 \lt x \leq 2 \\ 6 - x & \text{if} & x \gt 2 \end{matrix} \right.\ $$
In the previous section, to sketch a graph of a function, we chose some $x$-values to substitute into the formula to figure out $y$-values, and therefore determine points. We can take the same approach here, but we’ll need to make sure we use the right piece of the function for our chosen $x$-values.
If we start with $x$-values of -2, -1, 0, and 1, we’ll use the first piece of the function, since that is defined for a domain of $x \leq 1$:
| $x$-value | $f(x)$ | Point |
|---|---|---|
| $ − 2$ | $f(−2) = (−2)^2 = 4$ | $(−2,4)$ |
| $ − 1$ | $f(−1) = (−1)^2 = 1$ | $(−1,1)$ |
| $0$ | $f(0) = (0)^2 = 0$ | $(0,0)$ |
| $1$ | $f(1) = (1)^2 = 1$ | $(1,1)$ |

For the next part, we’ll choose $x$-values on the domain $1\lt x \leq 2$ and use the corresponding formula, $f(x) = 3$. We’ll use $x = 1$ and $x = 2$, although the point we graph for $x = 1$ will be represented with an open circle, since $x$ is strictly greater than 1 on this domain.
| $x$-value | $f(x)$ | Point |
|---|---|---|
| $1$ | $f(1) = 3$ | $(1,3)$ |
| $2$ | $f(2) = 3$ | $(2,3)$ |

For the third function, you may recognize this as a linear equation from your previous coursework. If you remember how to graph a line using slope and intercept, you can do that. Otherwise, we could calculate a couple values, plot points, and connect them with a line.
At x = 2, f(2) = 6 – 2 = 4. We place an open circle
here.
At x = 3, f(3) = 6 – 3 = 3. Connect these points with
a line.

Now that we have each piece individually, we combine them onto the same graph:

4. At Pierce College during the 2009-2010 school year tuition rates for in-state residents were \$89.50 per credit for the first 10 credits, \$33 per credit for credits 11-18, and for over 18 credits the rate is \$73 per credit^4. Write a piecewise defined function for the total tuition, T, at Pierce College during 2009-2010 as a function of the number of credits taken, c. Be sure to consider a reasonable domain and range.
Important Topics of this Section
Definition of domain
Definition of range
Inequalities
Interval notation
Set builder notation
Domain and Range from graphs
Piecewise defined functions
Section 1.2 Exercises
Conceptual Questions
- What are the domain and range of a function?
- How can we find a domain from a table? From a graph?
- How can we find a range from a table? From a graph?
- How does interval notation work?
- How do we read a piecewise function?
- How can we use the formula for a piecewise function to create a graph?
Practice Problems
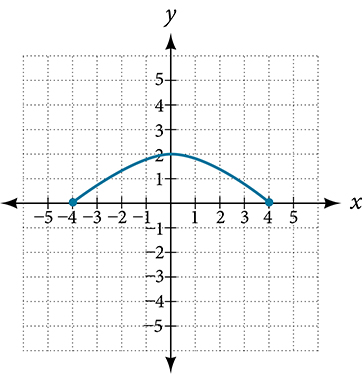
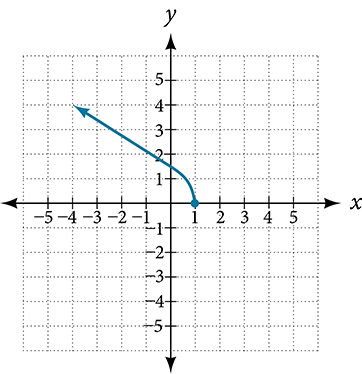
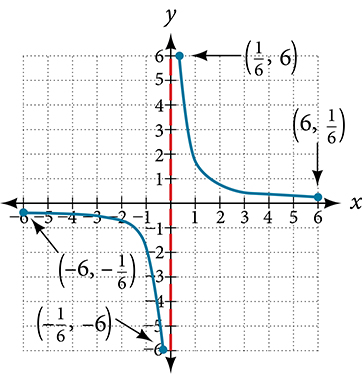
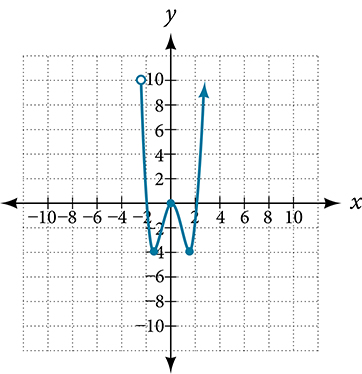
Write the domain and range of each graph as an inequality, and in interval notation.

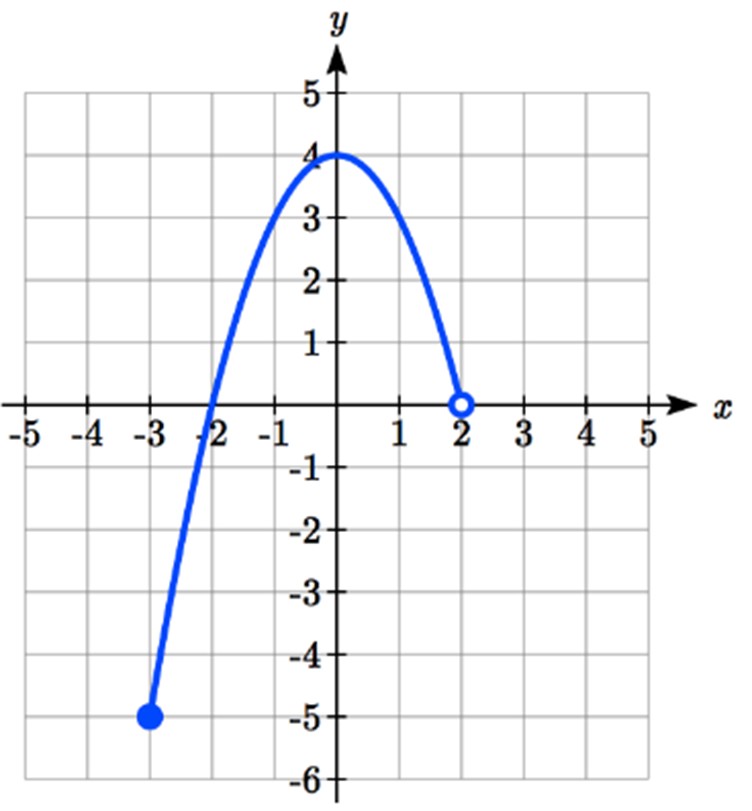




The domain is $[-5, 3);$ the range is $[0, 2]$
The domain is $(2, 8]$; the range is $[6, 8)$
The domain is $[-4, 4]$; the range is $[0, 2]$
The domain is $(-\infty, 1]$, the range is $[0, \infty)$
The domain is $\left\lbrack - 6,\ - \frac{1}{6} \right\rbrack \cup \lbrack\frac{1}{6},6\rbrack$; the range is $\left\lbrack - 6,\ - \frac{1}{6} \right\rbrack \cup \left\lbrack \frac{1}{6},6 \right\rbrack$
Suppose that you are holding your toy submarine under the water. You release it and it begins to ascend. The graph models the depth of the submarine as a function of time, stopping once the sub surfaces. What is the domain and range of the function in the graph?


The domain is $[0, 4]$, the range is $[-3, 0]$
Given each function, evaluate: $f(−1)$, $f(0)$, $f(2)$, $f(4)$
$f(x) = \left\{ \begin{matrix} 7x + 3 & \text{if} & x \lt 0 \\ 7x + 6 & \text{if} & x \geq 0 \end{matrix} \right.\ $
$f(x) = \left\{ \begin{matrix} 4x - 9 & \text{if} & x \lt 0 \\ 4x - 18 & \text{if} & x \geq 0 \end{matrix} \right.\ $
$f(x) = \left\{ \begin{matrix} x^{2} - 2 & \text{if} & x \lt 2 \\ 4 + |x - 5| & \text{if} & x \geq 2 \end{matrix} \right.\ $
$f(x) = \left\{ \begin{matrix} 4 - x^{3} & \text{if} & x \lt 1 \\ \sqrt{x + 1} & \text{if} & x \geq 1 \end{matrix} \right.\ $
$f(x) = \left\{ \begin{matrix} 5x & \text{if} & x \lt 0 \\ 3 & \text{if} & 0 \leq x \leq 3 \\ x^{2} & \text{if} & x \gt 3 \end{matrix} \right.\ $
$f(x) = \left\{ \begin{matrix} x^{3} + 1 & \text{if} & x \lt 0 \\ 4 & \text{if} & 0 \leq x \leq 3 \\ 3x + 1 & \text{if} & x \gt 3 \end{matrix} \right.\ $
$f(−1) = -4; f(0) = 6; f(2) = 20; f(4) = 34$
$f(−1) = -1, f(0) = -2, f(2) = 7$, $f(4) = 5$
$f(−1) = 0$, $f(0) = 3$, $f(2) = 3$, $f(4) = 16$
Write a formula for the piecewise function graphed below.


$f(x) = \left\{ \begin{matrix} 2 & \text{ if } & - 6 \leq x \leq - 1 \\ - 2 & \text{ if } & - 1 \lt x \leq 2 \\ - 4 & \text{ if } & 2 \lt x \leq 4 \end{matrix} \right.\ $
$f(x) = \left\{ \begin{array}{r} - x\ \ \ \text{ if }\ \ \ \ \ \ \ x \lt 0\ \\ x\ \ \ \ \text{ if }\ 0 \leq x \leq 2 \\ 3\ \ \ \ \text{ if }\ \ \ \ x \gt 2 \end{array} \right.\ $
Sketch a graph of each piecewise function
$f(x) = \left\{ \begin{matrix} |x| & \text{if} & x \lt 2 \\ 5 & \text{if} & x \geq 2 \end{matrix} \right.\ $
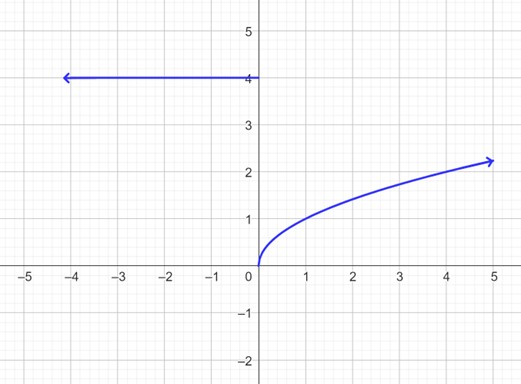
$f(x) = \left\{ \begin{matrix} 4 & \text{if} & x \lt 0 \\ \sqrt{x} & \text{if} & x \geq 0 \end{matrix} \right.\ $
$f(x) = \left\{ \begin{matrix} x^{2} & \text{if} & x \lt 0 \\ x + 2 & \text{if} & x \geq 0 \end{matrix} \right.\ $
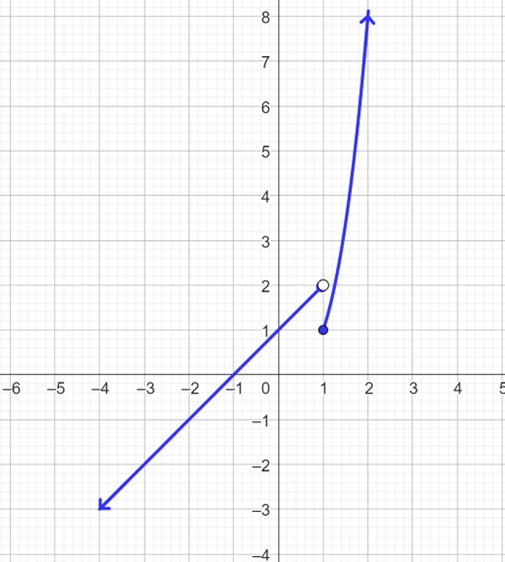
$f(x) = \left\{ \begin{matrix} x + 1 & \text{if} & x \lt 1 \\ x^{3} & \text{if} & x \geq 1 \end{matrix} \right.\ $
$f(x) = \left\{ \begin{matrix} 3 & \text{if} & x \leq - 2 \\ - x + 1 & \text{if} & - 2 \lt x \leq 1 \\ 3 & \text{if} & x \gt 1 \end{matrix} \right.\ $
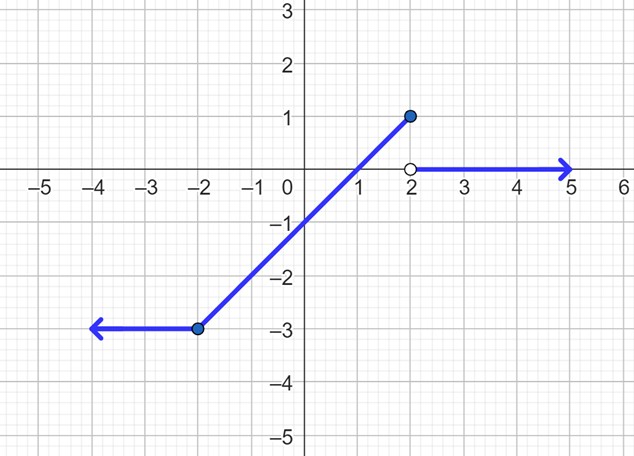
$f(x) = \left\{ \begin{matrix} - 3 & \text{if} & x \leq - 2 \\ x - 1 & \text{if} & - 2 \lt x \leq 2 \\ 0 & \text{if} & x \gt 2 \end{matrix} \right.\ $
http://en.wikipedia.org/wiki/Tree, retrieved July 19, 2010↩︎
https://pe.usps.com/text/dmm300/Notice123.htm, retrieved July 7, 2022↩︎
http://commons.wikimedia.org/wiki/File:Alaska_Crude_Oil_Production.JPG, CC-BY-SA, July 19, 2010↩︎
https://www.pierce.ctc.edu/dist/tuition/ref/files/0910_tuition_rate.pdf, retrieved August 6, 2010↩︎
