Section 1.3: Features of Functions
Suppose we have a function, $h(x)=-9.8x^2+110x+20$, which models the height in meters, $h$, of a pumpkin being trebucheted at time $x$ in seconds. If we know this function, can we figure out other interesting things about the situation, like the pumpkin’s initial height when it is released by the trebuchet? Or the time at which the pumpkin will hit the ground?
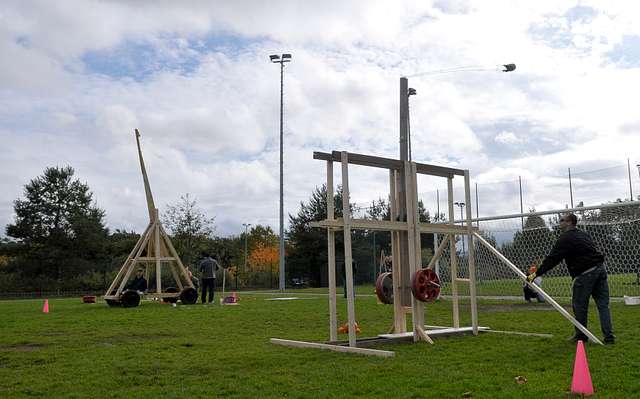
A punkin chunkin event at Ramstein Air Force Base.
Public Domain. information here
Intercepts
One of the ways we can go about answering some of these questions is by looking into the intercepts of the function. We’ll want to find where the graph of our function intersects the axes; these places will often have real-life interpretations.
Let’s start by looking at a general function and work our way up to our punkin chunkin problem.
X-Intercepts
The x-intercepts, or horizontal intercepts, of a function occur when the graph of the function touches the $x$-axis.
Y-Intercepts
The y-intercept, or vertical intercept, of a function occurs when the graph of the function touches the $y$-axis.
Given the graph of $f(x)$, find the $x$- and $y$-intercepts. Give your answers as ordered pairs.
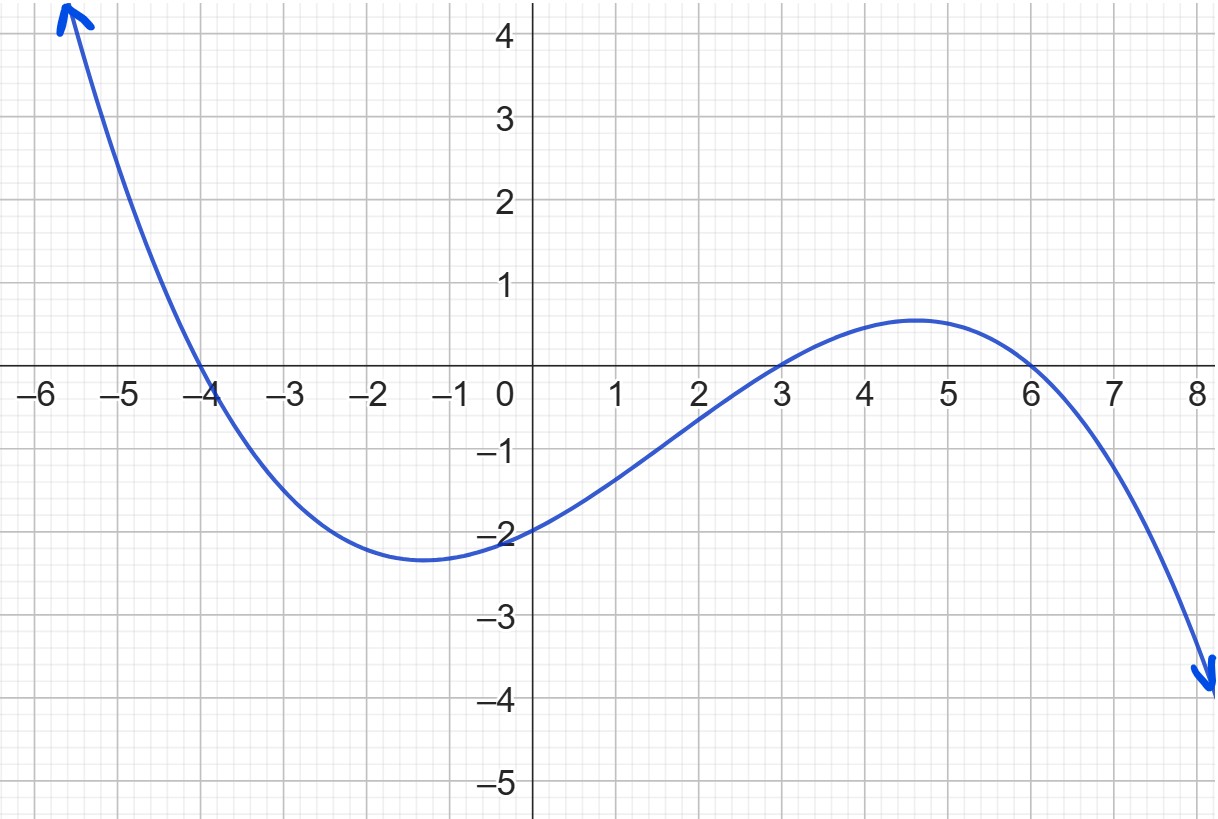
To look for $x$-intercepts, we’ll list the places where our graph intersects the horizontal, or $x$-axis. In this case, that happens when $x=-4$, $3$, and $6$. We want to list the ordered pairs, or $(x,y)$ points for each intercept. Notice that the height at each $x$-intercept is 0, so our list of $x$-intercepts is $(-4,0)$, $(3,0)$, and $(6, 0)$.
There is only one place where our graph intersects the vertical, or $y$-axis, and that is when $y=-2$. The $x$-value here is 0, so our $y$-intercept is $(0, -2)$.
That graphical example illuminates an important point: we see $x$-intercepts when $y=0$, and we see $y$-intercepts when $x=0$. That gives us a way of finding intercepts when we don’t have a graph in front of us!
Detecting Intercepts
To find an $x$-intercept of $f(x)$, solve the equation $f(x)=0$.
To find a $y$-intercept of $f(x)$, evaluate $f(0).$
Given the following table for $f(x)$, find the $x$- and $y$-intercepts.
| $x$ | $f(x)$ |
|---|---|
| $ -6$ | $0$ |
| $ -3$ | $1$ |
| $0$ | $4$ |
| $3$ | $0$ |
| $6$ | $ -4$ |
To find the $x$-intercepts, we’ll want to solve for when $f(x)=0$. We see that $f(x)$=0 when $x=-6$ and when $x=3$, so our $x$-intercepts are at $(-6, 0)$ and $(3, 0)$.
To find the $y$-intercept, we’ll evaluate $f(0)$. On the table, we see that when we have an input of $x=0$, the output is $4$, so $f(0)=4$ and our $y$-intercept is $(0, 4)$.
Given that $f(x)=x(x+2)(x-4)$, find the $x$- and $y$-intercepts.
Once again, to find the $x$-intercepts, we’ll solve for when $f(x)=0$. That creates the equation $x(x+2)(x-4)=0$. We can use the Zero Product Property to solve for $x=0, -2, $and 4. So, the $x$-intercepts are $(0,0)$, $(-2, 0)$, $(4, 0)$.
For the $y$-intercepts, we’ll evaluate $f(0)$.
$$f(0)=0(0+2)(0-4)=0\cdot 2\cdot -4=0.$$
That makes the $y$-intercept $(0,0)$.
Find the $x$ and $y$-intercepts for each function.
-
$x$ $f(x)$ $ -8$ $0$ $ -4$ $1$ $0$ $2$ $4$ $3$ $8$ $4$ $f(x)=6x -12$
Now we return to our flying pumpkin. If the function $h(x)=-9.8x^2+110x+20$ models the height $h$ in meters of the pumpkin at times $x$ seconds, then we can figure out some cool information about the situation with our intercepts!
A pumpkin is launched from a trebuchet. The function $h(x)=-9.8x^2+110x+20$ represents the pumpkin’s height, $h$, in meters at time $x$, in seconds.
What will the $x$-intercept tell us about this situation?
What will the $y$-intercept tell us about this situation?
Graph the function using technology. Find and interpret the intercepts.
To find the $x$-intercept, we’ll solve the equation $h(x)=0$. So, that will tell us when the pumpkin’s height ($h$) is 0. Finding the $x$-intercept will tell us the time at which the pumpkin hits the ground.
To find the $y$-intercept, we’ll evaluate $h(0)$. That means we’ll find the height, $h$, when $x=0$. This value will give us the pumpkin’s starting height, when it is released from the trebuchet.
We’ll graph the function using geogebra.org, a free online graphing calculator.

After adjusting the window and using the intercept tool, we see there are two $x$-intercepts, $(-0.179, 0)$ and $(12.401, 0)$. Only the second intercept makes sense in this situation, though, because our model doesn’t account for negative time. So, we see that the pumpkin hits the ground at 12.401 seconds.
The $y$-intercept is (0, 20), so the pumpkin’s starting height was $20$ meters.
We can also see a local maximum at the graph at around 6 seconds and a little over 350 meters. That’s the maximum height the pumpkin will reach!
End Behavior and Asymptotes
In many situations, we want to describe long term behavior, or end behavior, of a quantity. Suppose the function $f$ below models the spread of a rumor online in thousands of people, $f(x)$, at hour $x$.

At first (the $y$-intercept), hardly anyone has heard the rumor. Then, there is sharp uptake in the 60 to 120 hour range. Then, the rumor spread levels out again, getting near a level of 1,000,000 people as time goes on. As we look out to that extreme right side of the graph, we’re examining the graph’s end behavior.
End Behavior
The end behavior, or long-run behavior, of a function describes what happens to the function value (height) on the extreme right or extreme left side of the graph.
Right side end behavior
To describe right side end behavior, we examine what happens to the height on the extreme right side of the graph.
To indicate that we’re looking at the right side of the graph, we say that $x \to \infty$, since we are looking at extremely large values of $x$.
To describe the height, we may say one of the following:
As $x\to\infty, f(x)\to\infty$
This indicates that on the far right (as $x\to\infty)$, the height of the function grows without bound ($f(x)\to\infty)$.

As $x\to\infty, f(x)\to -\infty$
This indicates that on the far right (as $x\to\infty)$, the height of the function grows very large and negative without bound ($f(x)\to -\infty)$.

As $x\to\infty, f(x) \to L$
This indicates that on the far right (as $x\to\infty), $the height of the function grows closer and closer to a height of $L$ ($f(x) \to L)$.
Left side end behavior
To describe left side end behavior, we examine what happens to the height on the extreme left side of the graph.
To indicate that we’re looking at the right side of the graph, we say that $x\to -\infty$, since we are looking at extremely large and negative values of $x$.
To describe the height, we may say one of the following:

As $x\to -\infty, f(x)\to\infty$
This indicates that on the far right (as $x\to -\infty)$, the height of the function grows without bound ($f(x)\to\infty)$.
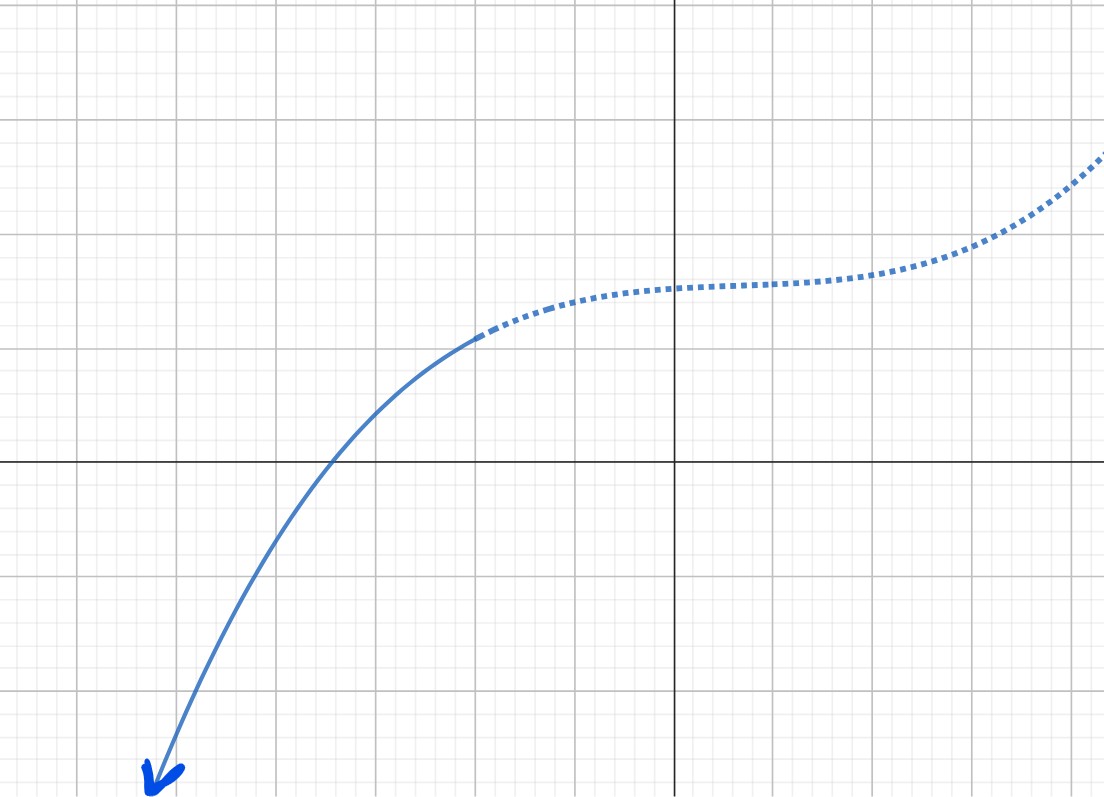
As $x\to -\infty, f(x)\to -\infty$
This indicates that on the far right (as $x\to -\infty)$, the height of the function grows very large and negative without bound ($f(x)\to -\infty)$.

As $x\to -\infty, f(x) \to L$
This indicates that on the far right (as $x\to -\infty), $the height of the function grows closer and closer to a height of $L$ ($f(x) \to L)$.
We have a special name for the times when the end behavior approaches a specific height, rather than growing without bound. We call these heights the horizontal asymptotes of a function.
Horizontal Asymptote
The horizontal line $y=L$ is a horizontal asymptote of $f(x)$ if:
As $x\to\infty, f(x) \to L$
or
As $x\to -\infty, f(x)\to L$
Describe the end behavior of $f(x)$, graphed below:
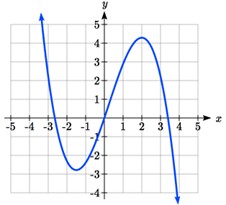
Since on the far right side of the graph, the arrow points down, we see that the height values are growing very large and negative. Therefore
$$\text{As } x\to\infty, f(x)\to -\infty.$$
On the far left side of the graph, the arrow points up. That tells us that the heights are growing very large, so
$$\text{As } x\to\infty, f(x)\to\infty$$
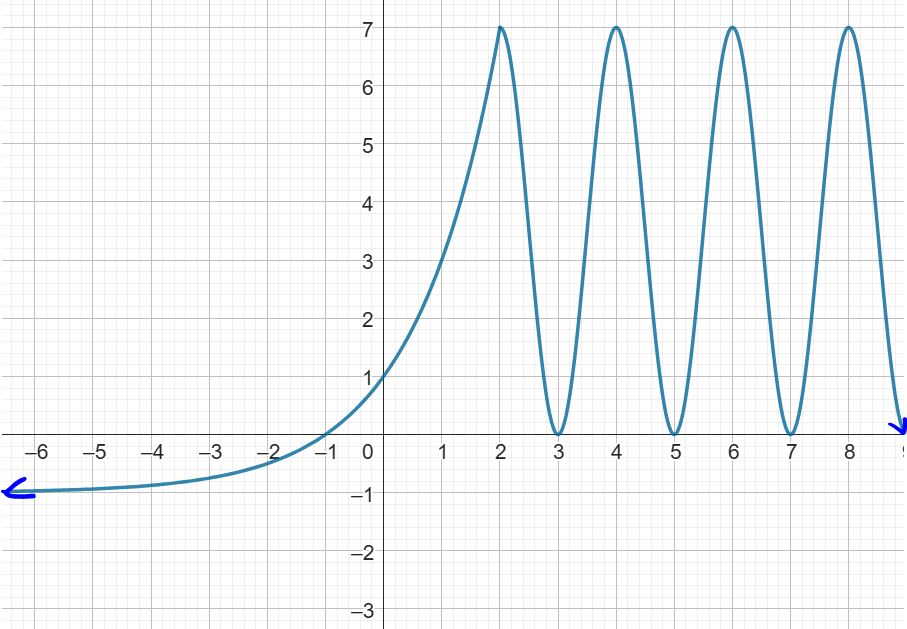
Describe the end behavior of $g(x)$, graphed below:

There’s a lot going on in this function, but most of it is a distraction to the task at hand. We only need to look at the height of the function on the far right and the far left sides of the graph.
On the far right, the function oscillates, but the oscillations get smaller and smaller. They are getting closer and closer to a height of 1, so
$$\text{As } x\to\infty, g(x) \to 1.$$
So, there is a horizontal asymptote at $y=1.$
On the far left, the function goes downward. The heights grow very large and negative, so
$$\text{As } x\to -\infty, g(x)\to -\infty.$$
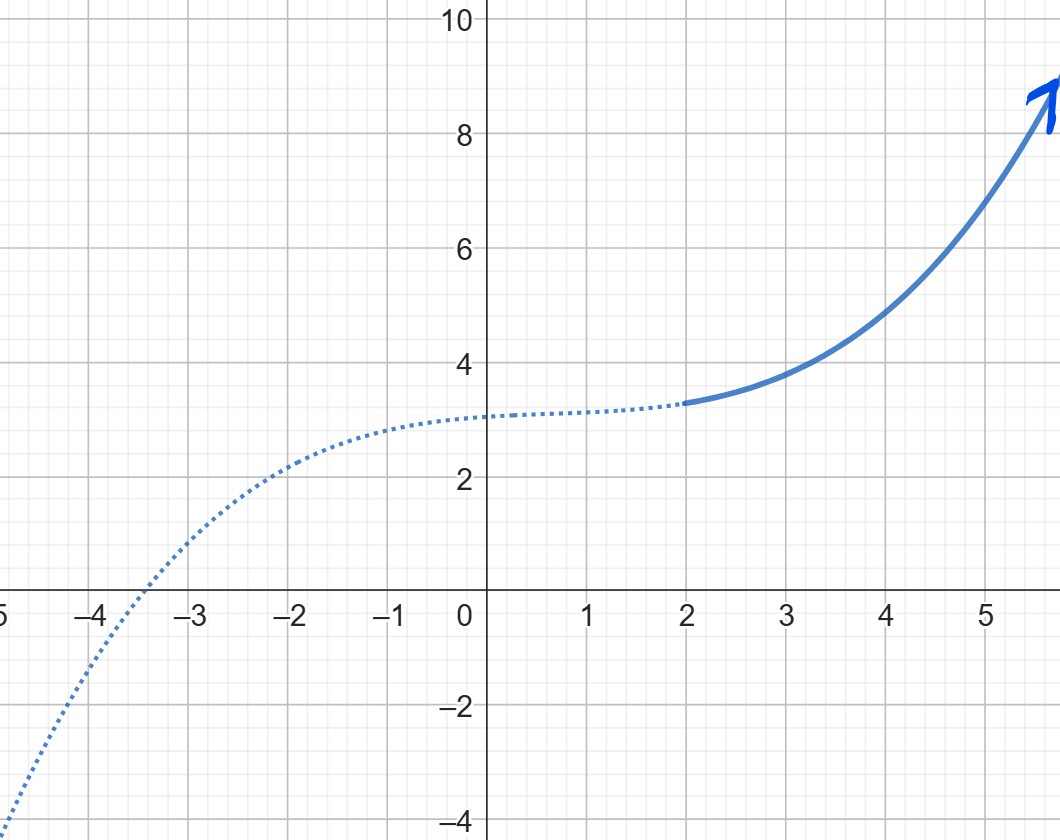
Describe the end behavior of $h(x)$, graphed below:

Symmetry
Another feature of functions that often interests mathematicians is symmetry. Symmetry, roughly speaking, means that a function is reflected across a line or point, so that it is the same on opposite sides of that reflection. At this time, we will mainly focus on $y$-axis and origin symmetry.
Let’s examine a single point and how it reflects first. We’ll look at point $(a,b)$ and reflect it across the $y$-axis.

We reflect that point across the $y$-axis. It’s now at the same height, but its $y$-value is the opposite. That makes the reflected point $(-a,b)$.
If we turn to function notation, for the original point we see $f(a)=b$, and for the reflected point $f(-a)=b$. In other words, $f(a)=f(-a)$
If a function is symmetric about the $y$-axis, then every point on the function will be reflected in this way.
Y-axis symmetry
A function is symmetric about the $y$-axis if $f(x)=f(-x)$ for every $x$ in the domain.
Functions with $y$-axis symmetry are said to be even functions.
Another important type of symmetry is origin symmetry. We’ll begin again with a single point:

The reflected point has an opposite $x$ and an opposite $y$-coordinate. That means $(a,b)$ becomes $(-a,-b)$ when it is reflected across the origin.
In function notation, the original point $f(a)=b$, becomes $f(-a)=-b$, so in a function with this type of symmetry, $f(-a)=-f(a)$.
Origin Symmetry
A function is symmetric about the origin if $f(-x)=-f(x)$ for every $x$ in the domain.
Functions with origin symmetry are said to be odd.
Determine whether each function is even, odd, or neither.
$f(x)=x^2+1$
$f(x)=x^3+x$
$f(x)=x^3+1$
We’ll want to check each function for symmetry. To do so, we’ll compare $f(x)$ to $f(-x)$.
We know that $f(x)=x^2+1$. Now let’s examine $f(-x)$:
$$\begin{array}{rl} f(-x) & =(-x)^{2}+1 \\ & =-x\cdot-x+1 \\ & =x^{2}+1 \\ & =f(x) \end{array}$$ Our calculations show that $f(-x)=f(x)$, so the function has $y$-axis symmetry. It is an even function.Here, we start with $f(x)=x^3+x$. We’ll first check $f(-x):$
$$\begin{array}{rl} f(-x) & =(-x)^{3}+(-x) \\ & =-x\cdot-x\cdot-x+(-x) \\ & =-x^{3}+(-x) \\ & =-\left( x^{3}+x \right) \\ & =-f(x) \end{array}$$ That means $f(-x)=-f(x)$, so the function has origin. This function is odd.Finally, we investigate $f(x)=x^3+1.$ Again, we want to know what $f(-x)$ looks like:
$$\begin{array}{rl} f(-x) & =(-x)^{3}+1 \\ & =-x^{3}+1 \end{array}$$ Well that’s…nothing. It’s not the same as $f(x)$, and it’s not the opposite of $f(x).$ That means this function is neither even nor odd.
Determine whether each function is even, odd, or neither:
$f(x)=x^5 -x^3$
$f(x)=x^5 -x^2$
$f(x)=x^4 -x^6$
Inequalities
Let’s think about another flying object, this time a ball being launched from a device designed to throw balls for overactive dogs. An equation that might describe the height of such a ball is $f(x)=-16x^2+96x$, where $f$ is the height in feet and $x$ is the time in seconds. We’re interested in figuring out how long the ball is in the air. In other words, we want to know for what $x$-values $f(x) ≥ 0$.
On a graph, we want to find the interval of $x$-values when the graph is above the $x$-axis:
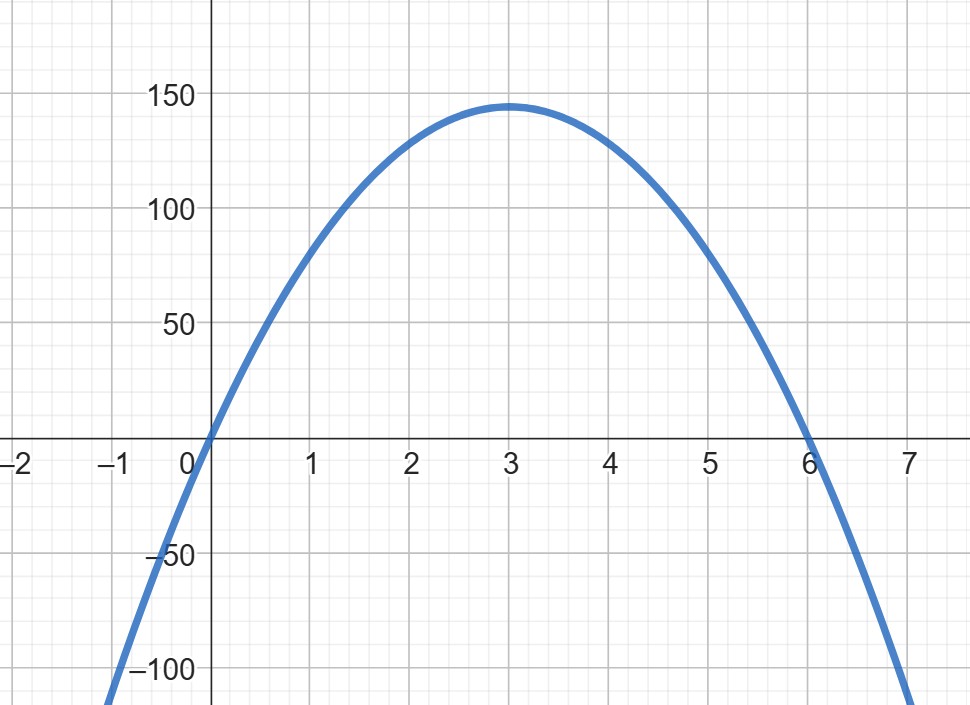
We see that the heights of the function are greater than or equal to 0 between $x=0$ and $x=6$. In other words, the solution to $ -16x^2+96x \geq 0$ is $[0, 6]$.
We could also use the function to determine how long the ball is above 50 feet. For that, we’re solving $f(x) \geq 50$, or $ -16x^2+96x \geq 50$. That would be in this red region of the graph:

So, the ball is above a height of 50 feet from 0.576 to 5.424 seconds from launch, and the solution to the inequality $ -16x^2+96x \geq 50$ is $[0.576, 5.424].$
Solution to an inequality
The solution to an inequality in the form $f(x) \gt a$ or $f(x) \geq a$ is an interval of $x$-values which describes the region where the function $f(x)$ has a height that is higher than (or equal to) $a$.
The solution to an inequality in the form $f(x) \lt b$ or $f(x) \leq b$ is an interval of $x$-values which describes the region where the function $f(x)$ has a height that is lower than (or equal to) $b$.
Use the graph of $f(x)$ to solve the following inequalities:

$f(x)\leq 0$
$f(x)\gt 3$
To solve $f(x)\leq 0, $we want to find where the function has a height of 0, or a height lower than 0 (that is, negative). That is in the following regions (highlighted in orange):

Our solution to the inequality, then, are the $x$-value intervals which describe this region:
$( -11, -7]\cup[4, 8].$
Notice that -7, 4, and 8 have brackets, because our inequality states we want $f(x)$ to be less than or equal to 0. The value -11 must have parentheses, because the function has an open circle at that $x$-location.
To solve $f(x)\gt 3$, it’s useful to plot a line at a height of 3. Then we can more easily spot the regions where the graph of $f(x)$ has heights that are taller than 3.
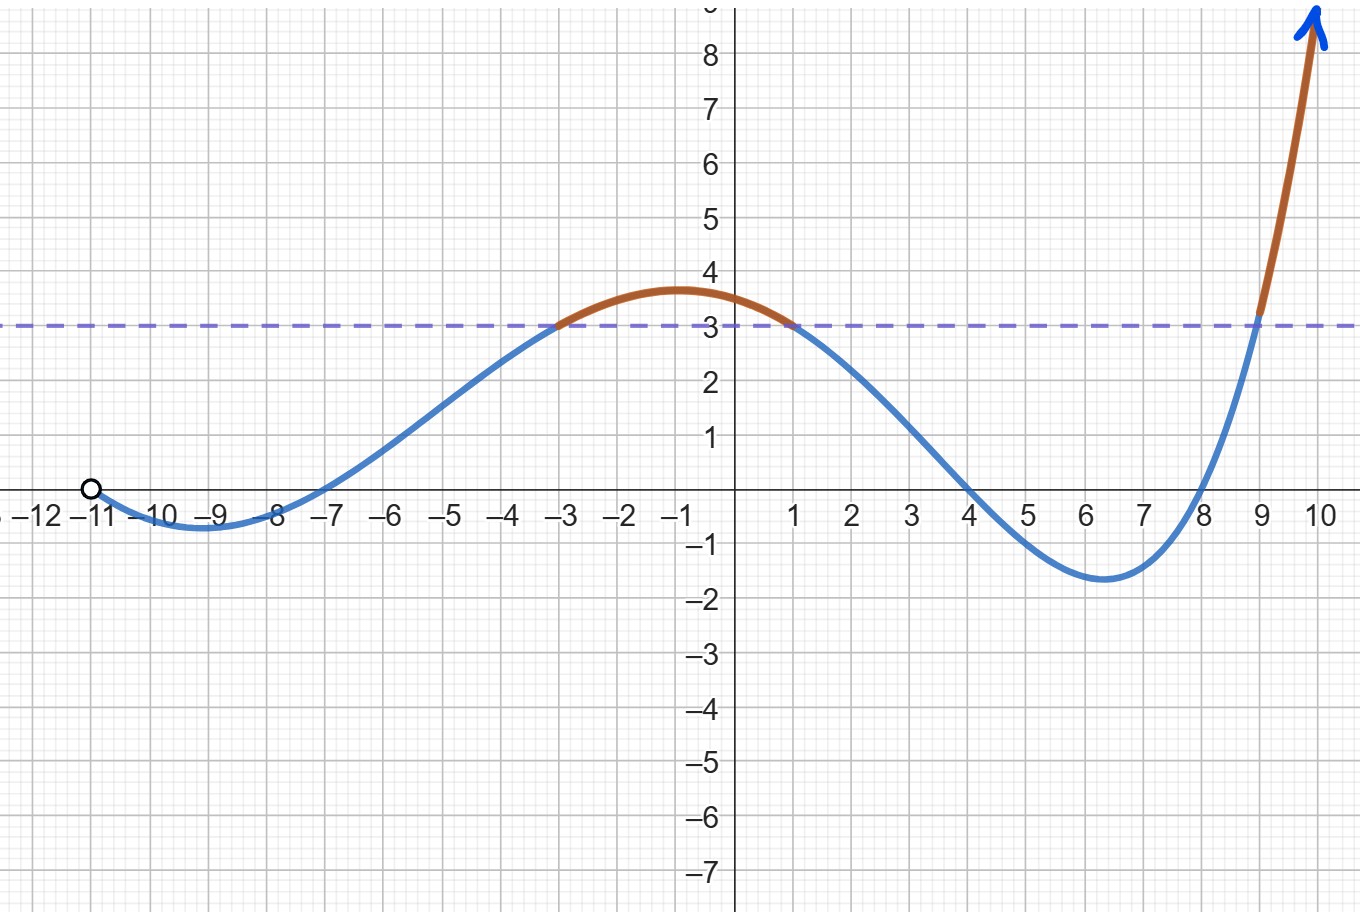
Since our inequality specifies we want heights strictly greater than (not equal to) 3, our solution is $(-3, 1)\cup(9, \infty)$.
Use the graph of $f(x)$ to solve the following inequalities.

$f(x)\lt -3$
$f(x)\geq 0$
Important Topics in this Section
$x$- and $y$-intercepts
End behavior
Horizontal Asymptotes
Symmetry
Solving inequalities graphically
Section 1.3 Exercises:
Conceptual Questions
What are intercepts?
How can we find intercepts on a graph? From a formula?
What types of real world situations might require us to find an x-intercept? A y-intercept?
What is end behavior? How do we describe it?
What is symmetry? How can we find it in a graph? From a formula?
How can we solve inequalities from a graph of a function?
Practice Problems
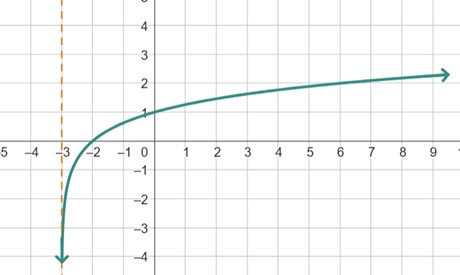
For each function graphed below, describe a) the intercepts, b) the end behavior c) whether the function is even, odd, or neither. Dotted lines will indicate the presence of asymptotes.
(a) $x$-intercepts: -2, 2; $y$-intercept: -4, (b) As $x \to \pm \infty, f(x) \to \infty$, (c) even
(a) $y$-intercept: -1, (b) As $x \to \pm \infty, f(x)\to 0$, (c) neither
(a)$x$-intercept: -2, $y$-intercept: 1, (b) As $x \to \infty, f(x) \to \infty$, as $x \to -3^{+}, f(x) \to -\infty$, (c) neither
Determine whether each function is even, odd, or neither. Justify your answer.
$f(x)=3x^{4}$
$g(x)=\sqrt{x}$
$h(x)=\frac{1}{x}+3x$
$f(x)=(x−2)^{2}$
$g(x)=2x^{4}$
$h(x)=2x − x^{3}$
Even
Odd
Even
Given each function, determine the $x$- and $y$- intercepts.
$f(x)=-3x+6$
$g(x)=\frac{1}{2}x -4$
$h(x)=8(x+3)-2$
$f(x)=7x^{2}$
$g(x)=(x−2)^{2}+4$
$h(x)=2x^{2}+3x+1$
$x$: 2, $y : 6$
$x:\ - \frac{11}{4}$, $y : 22$
$x: $none; $y: $8
Given each graph of $f(x)$, solve the indicated inequality.
$f(x)\gt 5$

$f(x)\geq 0$
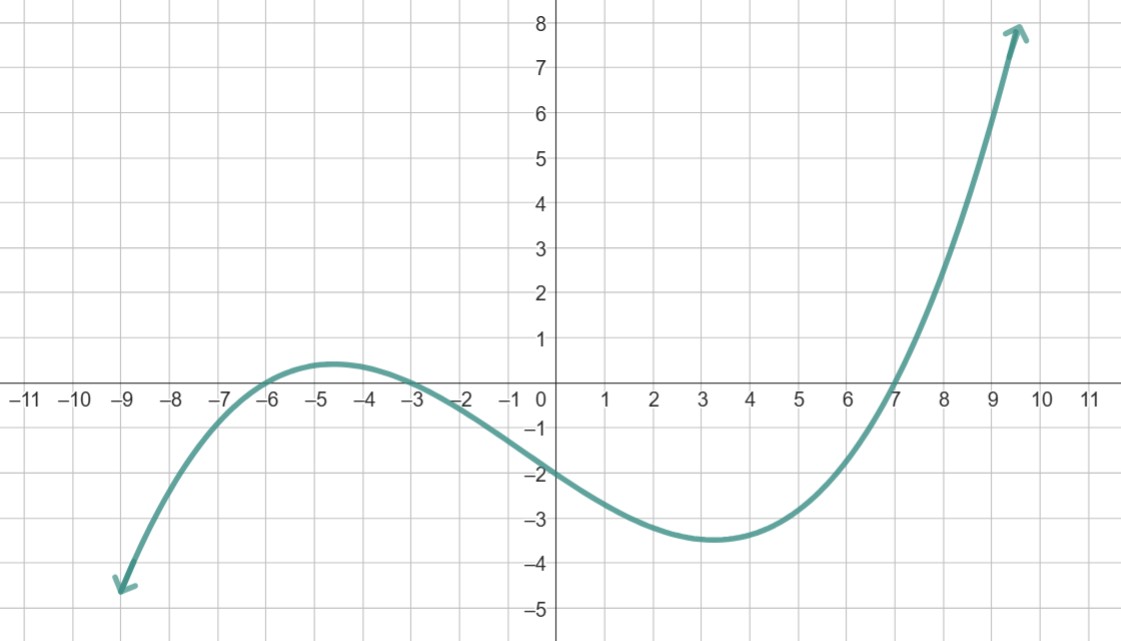
$f(x)\lt 0$
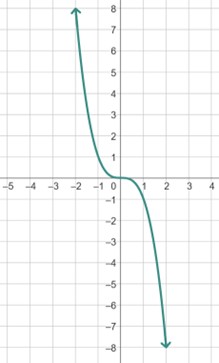
$f(x)\leq -3$

$f(x)\leq 1$
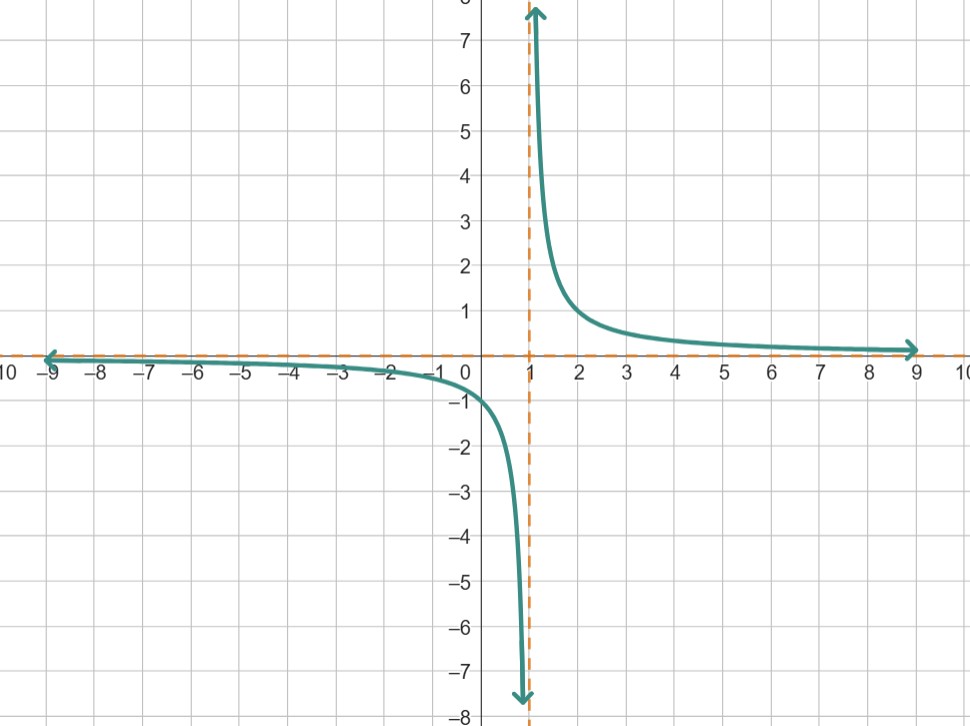
$(-\infty, -3 ∪ (3, \infty)$
$(0,\infty)$
$(−\infty, 1) ∪ (1, 2]$