Section 2.1: Linear Functions
Chapter one was a window that gave us a peek into the entire course. Our goal was to understand the basic structure of functions and function notation, the toolkit functions, domain and range, how to recognize and understand composition and transformations of functions and how to understand and utilize inverse functions. With these basic components in hand we will further research the specific details and intricacies of each type of function in our toolkit and use them to model the world around us.
Mathematical Modeling
As we approach day to day life we often need to quantify the things around us, giving structure and numeric value to various situations. This ability to add structure enables us to make choices based on patterns we see that are weighted and systematic. With this structure in place we can model and even predict behavior to make decisions. Adding a numerical structure to a real world situation is called Mathematical Modeling.
When modeling real world scenarios, there are some common growth patterns that are regularly observed. We will devote this chapter and the rest of the book to the study of the functions used to model these growth patterns.
Linear Functions
As you hop into a taxicab in Las Vegas, the meter will immediately read \$3.50; this is the “drop” charge made when the taximeter is activated. After that initial fee, the taximeter will add $2.76 for each mile the taxi drives1. In this scenario, the total taxi fare depends upon the number of miles ridden in the taxi, and we can ask whether it is possible to model this type of scenario with a function. Using descriptive variables, we choose $m$ for miles and $C$ for Cost in dollars as a function of miles: $C(m)$.
We know for certain that $C(0)=3.50$, since the \$3.50 drop charge is assessed regardless of how many miles are driven. Since $2.67 is added for each mile driven, then
$C(1)=3.50+2.67=6.17.$
If we then drove a second mile, another $2.67 would be added to the cost:
$C(2)=3.50+2.67+2.67=3.50+2.67(2)=8.84$
If we drove a third mile, another $2.67 would be added to the cost:
$C(3)=3.50+2.67+2.67+2.67=3.50+2.67(3)=11.51$
From this we might observe the pattern, and conclude that if m miles are driven,$C(m)=3.50+2.67m$ because we start with a $3.50 drop fee and then for each mile increase we add \$2.67.
It is good to verify that the units make sense in this equation. The \$3.50 drop charge is measured in dollars; the \$2.67 charge is measured in dollars per mile.
$$C(m)=3.50\ \text{dollars}+\left( 2.67\frac{\text{dollars}}{\text{mile}} \right)\left( m\mspace{6mu}\text{miles} \right)$$
When dollars per mile are multiplied by a number of miles, the result is a number of dollars, matching the units on the 3.50, and matching the desired units for the $C$ function.
Notice this equation $C(m)=3.50+2.67m$ consisted of two quantities. The first is the fixed \$3.50 charge which does not change based on the value of the input. The second is the \$2.67 dollars per mile value, which is a rate of change. In the equation, this rate of change is multiplied by the input value.
Looking at this same problem in table format we can also see the cost changes by \$2.67 for every 1 mile increase.
| m | 0 | 1 | 2 | 3 |
|---|---|---|---|---|
| C(m) | 3.50 | 6.17 | 8.84 | 11.51 |
It is important here to note that in this equation, the rate of change is constant; over any interval, the rate of change is the same.
Graphing this equation, $C(m)=3.50+2.67m$ we see the shape is a line, which is how these functions get their name: linear functions.
When the number of miles is zero the cost is $3.50, giving the point (0, 3.50) on the graph. This is the vertical or C(m) intercept. The graph is increasing in a straight line from left to right because for each mile the cost goes up by $2.67; this rate remains consistent.

In this example, you have seen the taxicab cost modeled in words, an equation, a table and in graphical form. Whenever possible, ensure that you can link these four representations together to continually build your skills. It is important to note that you will not always be able to find all 4 representations for a problem and so being able to work with all 4 forms is very important.
Slope
That first example taught us some important facts about linear functions. One crucial idea is that the rate of change is constant. In fact, we give the rate of change a special name: the slope of the function.
Slope: Rate of Change in Linear Functions
Linear functions have a constant rate of change. That is, no matter what pair of points we use to calculate an average rate of change for a linear function, we will get the same average rate of change every time.
This constant rate of change of a linear function is called the slope and is often described with the variable $m$.
Slope and Increasing/Decreasing
$m$ is the constant rate of change of the function (also called slope). The slope determines if the function is an increasing function or a decreasing function. For a linear function $f(x)$,
$f(x)$ is an increasing function if $m \gt 0$
$f(x)$ is a decreasing function if $m \lt 0$
If $m=0$, the rate of change is zero, and the function $f(x)$ is just a horizontal line, neither increasing nor decreasing.
Calculating Slope (rate of change)
Given two values for the input,$x_1$ and $x_2$, and two corresponding values for the output, $y_1$ and $y_2$, or a set of points, $(x_1, y_1)$ and $(x_2, y_2)$, we can calculate the slope (the constant rate of change), $m$:
$$m=\frac{\text{change in output}}{\text{change in input}}=\frac{\Delta y}{\Delta x} = \frac{y_{2} -y_{1}}{x_{2} -x_{1}} = \frac{\text{rise}}{\text{run}}$$
Note in function notation, $y_1=f(x_1)$ and $y_2=f(x_2)$, so we could equivalently write
$$m=\frac{f\left( x_{2} \right) - f\left( x_{1} \right)}{x_{2} -x_{1}}$$
One of the ways of thinking about the slope is
$$m=\frac{\text{change of output}}{\text{change of input}}=\frac{\text{rise}}{\text{run}}$$
We can see this on a graph by stair-stepping our way from one point to another. The vertical distance is the “rise” and the horizontal distance is the “run.”

The population of a city increased from 23,400 to 27,800 between 2002 and 2006. Find the rate of change of the population during this time span.
The rate of change will relate the change in population to the change in time. The population increased by $27800-23400=4400$ people over the 4 year time interval. To find the rate of change, the number of people per year the population changed by:
$$\frac{4400\ \text{people}}{4\ \text{years}}=1100\frac{\text{people}}{\text{year}}=\ 1100\ \text{people per year}$$
Notice that we knew the population was increasing, so we would expect our value for m to be positive. This is a quick way to check to see if your value is reasonable.
The pressure, P, in pounds per square inch (PSI) on a diver depends upon their depth below the water surface, d, in feet, following the equation $P(d)=14.696+0.434d$. Interpret the components of this function.
The rate of change, or slope, 0.434 would have units $$\frac{\text{output}}{\text{input}} = \frac{\text{pressure}}{\text{depth}} = \frac{\text{PSI}}{\text{ft}}.$$ This tells us the pressure on the diver increases by 0.434 PSI for each foot their depth increases.
The initial value, 14.696, will have the same units as the output, so this tells us that at a depth of 0 feet, the pressure on the diver will be 14.696 PSI.
If $f(x)$ is a linear function, $f(3)=-2$, and $f(8)=1$, find the rate of change.
$f(3)=-2$ tells us that the input 3 corresponds with the output -2, and $f(8)=1$ tells us that the input 8 corresponds with the output 1. To find the rate of change, we divide the change in output by the change in input:
$$m=\frac{\text{change in output}}{\text{change in input}}=\frac{1 -( -2)}{8 -3} = \frac{3}{5}.$$ If desired we could also write this as m = 0.6
Note that it is not important which pair of values comes first in the subtractions so long as the first output value used corresponds with the first input value used.
Given the two points (2, 3) and (0, 4), find the rate of change. Is this function increasing or decreasing?
Slope-Intercept Form
There are different ways that we can think of a linear function’s equation. Different formats of the equation can reveal different features of the function.
As we study different functions, let’s focus on the idea that
Algebra isn’t really only about “solving for x.” Algebra allows us to rearrange functions into different forms so we can understand
We’ll focus first on a special form of a linear function: the slope-intercept form.
Slope-Intercept Form of a Linear Function
A linear function is a function whose graph produces a line. Linear functions can always be written in the form
$$f(x)=mx+b$$
where
$b$ is the vertical intercept, i.e. the initial or starting value of the function, and
$m$ is the slope, i.e. the constant rate of change of the function
Since this format of a linear function readily reveals the slope, $m$, and the vertical intercept, $b$, the equation $f(x)=mx+b$ is called the slope-intercept form of a line.
Many people like to write linear functions in the form $f(x)=b+mx$ because it corresponds to the way we tend to speak: “The output starts at b and increases at a rate of m.”
If we think of transformations then the form $f(x)=mx+b$ tells us the vertical stretch is a factor of m and the vertical shift is b.
Marcus currently owns 200 songs in his iTunes collection. Every month, he adds 15 new songs. Write a formula for the number of songs, N, in his iTunes collection as a function of the number of months, m. How many songs will he own in a year?
The initial value for this function is 200, since he currently owns 200 songs, so $N(0)=200$. The number of songs increases by 15 songs per month, so the rate of change is 15 songs per month. With this information, we can write the formula:
$$N(m)=15m+200.$$
$N(m)$ is an increasing linear function.
With this formula we can predict how many songs he will have in 1 year (12 months):
$$N(12)=15(12)+200=180+200=380.$$
Marcus will have 380 songs in 12 months.
If you earn \$30,000 per year and you spend \$29,000 per year write an equation for the amount of money you save after y years, if you start with nothing. “The most important thing, spend less than you earn!2”
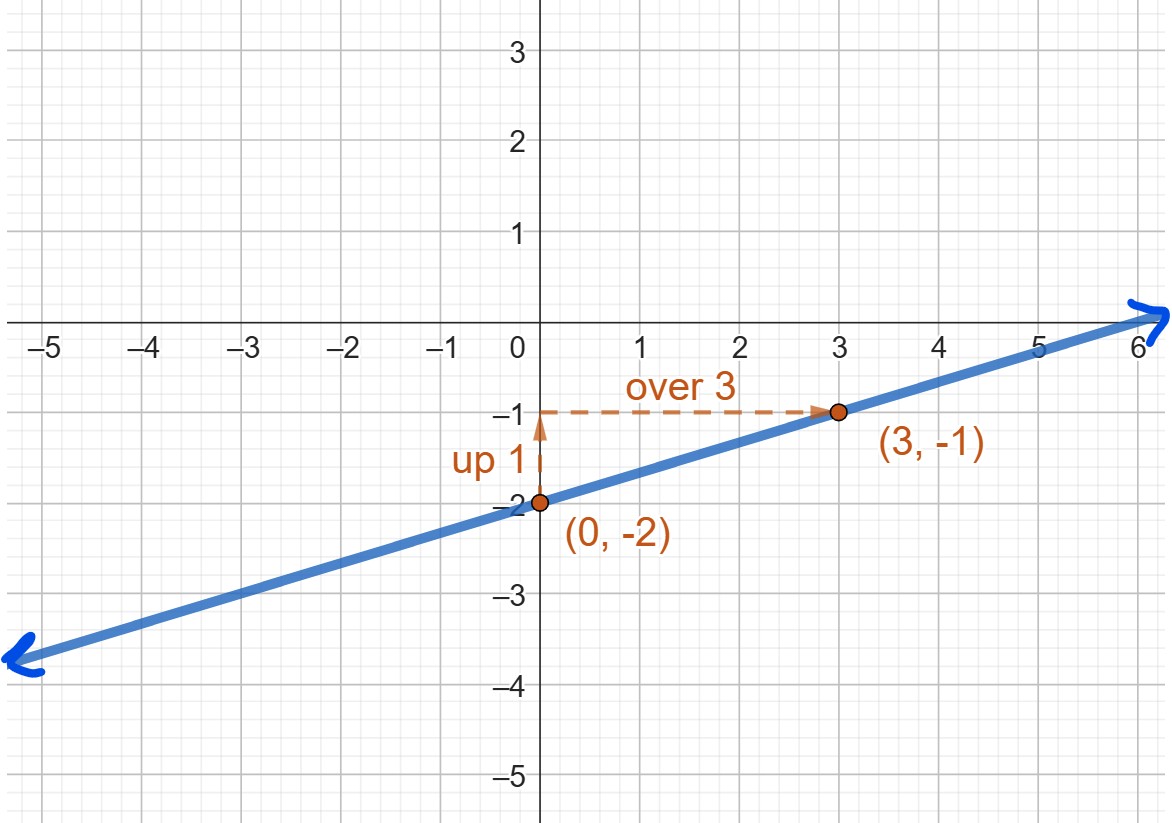
Graph the equation of the line $$f(x) = \frac{1}{3}x -2.$$
Now we have some options for how we want to graph this. We could use transformations, but we could also use what we know about the $f(x)=mx+b$ form of a line.
Here, we know the $y$-intercept is -2, and the slope is $\frac{1}{3}.$ So, we could start at the point -2 on the $y$-axis, and then find another point by going up 1 and over 3, since the slope describes the rise over the run. Connect those points, and we have the graph of our line!
We can now find the rate of change given two input-output pairs, and can write an equation for a linear function once we have the rate of change and initial value. There is another format of the equation of a line that can also be helpful if we know the slope of the line and a point which lies on the line.
Point-Slope Form and the Toolkit Linear Function
Point-Slope form of a Linear Function
If a line passes through the point $(c, d)$ and has slope $m$, then an equation for the line is
$$f(x)=m(x−c)+d.$$
The point-slope form of a linear equation is directly connected to transformations. We can think of this as a linear equation where the “starting point” (0,0) has be shifted c units to the right or left, and d units up or down. Then the graph is vertically stretched by the slope, $m$.
In fact, let’s take a moment to create a toolkit linear function that we can use to think about these transformations.
Toolkit Linear Function
The “toolkit” linear function is
$$f(x)=x.$$
It is sometimes called the “identity” function.
This function passes through the points
| $x $ | $ f(x)$ |
|---|---|
| $-2 $ | $ -2$ |
| $-1 $ | $ -1$ |
| $0 $ | $ 0$ |
| $1 $ | $ 1$ |
| $2 $ | $ 2$ |
And its graph is a straight, constantly increasing line.

Features of the toolkit linear function
- Intercepts: The $x$ and $y$ intercept is (0,0)
- Domain: $(-\infty,\infty)$
- Range: $(-\infty,\infty)$
- End behavior: As $x\to\infty, f(x)\to\infty$ and as $x\to -\infty, f(x)\to- \infty$
- Increasing on $(-\infty,\infty)$
- Origin symmetry (odd)
Graph the equation of the line $g(x) = -3(x+1)-2$.
We’ll take this from two points of view: transformations of the toolkit, and the point-slope form of the equation.
First, if we want to use transformation techniques, we want to identify the parent function. This means, we want to decide, what structure is the input a part of? Here, our input $x$ isn’t really a part of anything special (not in a power, or a root, or anything like that). Our parent function is the linear function, $f(x)=x.$
Our transformed function, $g,$ can then be written as $$g(x) = af(bx+c)+d$$ $$=-3(x+1)-2.$$
From this, we see that $a=-3, c=1,$ and $d=2.$ This means our toolkit function will be shifted left 1, flipped around the x-axis and vertically stretched by 3, and shifted down 2.
| $x-1$ | $\leftarrow x$ | $f(x)=x \rightarrow$ | $-3\cdot y \rightarrow$ | $y-2$ |
|---|---|---|---|---|
| $-2-1=-3$ | $-2$ | $-2$ | $-3\cdot-2=6$ | $6-2=4$ |
| $-1-1=-2$ | $-1$ | $-1$ | $-3\cdot-1=3$ | $3-2=1$ |
| $-0-1=-1$ | $0$ | $0$ | $-3\cdot 0=0$ | $0-2=-2$ |
| $1-1=0$ | $1$ | $1$ | $-3\cdot 1=-3$ | $-3-2=-5$ |
| $2-1=1$ | $2$ | $2$ | $-3\cdot 2=-6$ | $-6-2=-8$ |
| $x $ | $ g(x)$ |
|---|---|
| $-3 $ | $ 4 $ |
| $-2 $ | $ 1$ |
| $-1 $ | $ -2$ |
| $0 $ | $ -5$ |
| $1 $ | $ -8$ |
Perhaps, though, things would be more simple if we considered the format of the equation and what it tells us about the line.
The equation $g(x)=-3(x+1)-2$ looks most similar to the format $f(x)=m(x-c)+d,$ which is a line through the point $(c,d)$ with slope $m.$ So, we know our line should pass through the point $(-1,-2)$ and have a slope $-3/1.$ That means, we could graph the point $(-1,-2),$ then go down three and right one to find the next point.
Following these directions, we produce this line:

Note that this line passes through all the points indicated in the table we made using transformations!
In a moment, we’ll describe the features of the function from the previous example. First, let’s remind ourselves about how to find x- and y-intercepts.
For a function $f(x)$...
- To find the $y$-intercept, evaluate $f(0)$.
- To find $x$-intercepts, solve $f(x)=0$.
Describe the features of the function $g(x) = -3(x+1)-2.$
We’ll focus on the rate of change, whether the function is increasing or decreasing, the intercepts, the domain and range, and the end behavior.
First, the rate of change (aka the slope) is a constant $-3.$ That means the function is always decreasing.
Now, for the intercepts. Our graph in the previous example clearly shows the $y$-intercept is at $-5.$ We could also find this by evaluating $g(0)= -3(0+1)-2=-5.$ For the $x$-intercept, we’ll need to solve $g(x)=0:$ $$-3(x+1)-2=0$$ $$-3x-3-2=0$$ $$-3x-5=0$$ $$-3x=5$$ $$x=-5/3$$
That is consistent with the $x$-intercept we saw on the graph in previous example.
The domain and range are both $(-\infty,\infty).$
Since the function is decreasing, for end behavior we see that as $x\to \infty, g(x)\to -\infty$ and as $x\to -\infty,g(x)\to \infty.$ That is, the graph falls on the right, and rises on the left.
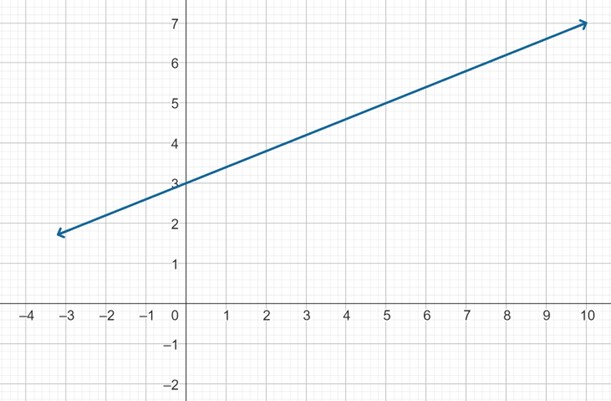
Write an equation for the linear function graphed below.
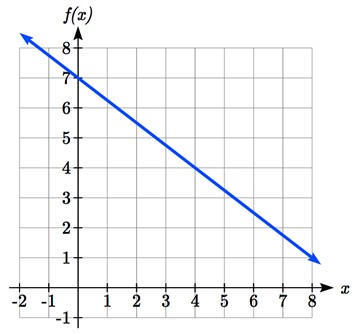
Looking at the graph, we might notice that it passes through the points (0, 7) and (4, 4). From the first value, we know the initial value ($y$-intercept) of the function is b=7, so in this case we will only need to calculate the rate of change (slope):
$$m=\frac{4 -7}{4 -0}=\frac{- 3}{4}$$
Now we know the slope and the $y$-intercept; this allows us to write the slope-intercept equation:
$$f(x)=mx+b$$
$$f(x)=-\frac{3}{4}x + 7$$
We could, equivalently, use our calculated slope $m=-\frac{3}{4}$ and any point on the line to write an equation of the line. Let’s use the point (4,4) and see what happens. If we have point $(4,4)$ and slope $-\frac{3}{4}$, then our equation would be
$$f(x)=m(x−c)+d$$
$$f(x)=-\frac{3}{4}(x -4) + 4$$
But, is this really the same as our other equation, $f(x)=-\frac{3}{4}x + 7$? Let’s simplify to find out.
$$f(x)=-\frac{3}{4}x + 3 + 4$$
$$= -\frac{3}{4}x + 7$$
Yes, they’re the same!
The previous example is a good illustration of our big theory of algebra. Different forms of the equation of the line allowed us to understand different features of the line!
If $f(x)$ is a linear function, $f(3)=-2$, and $f(8)=1$, find an equation for the function. Then describe the features of the function.
In example 3, we computed the rate of change to be $m=\frac{3}{5}$. In this case, we do not know the initial value $f(0)$, so the slope-intercept form of the equation isn’t our best bet. Let’s use the point-slope form of the equation. Once we have that, we can simplify to make the slope-intercept form if we really want it.
The slope is $\frac{3}{5}$ and a point on the line is $(3, −2)$, so
$$f(x)=m(x−c)+d$$
$$f(x)=\frac{3}{5}(x -3) - 2$$
This is an equation for the function, but we can simplify it if we want.
$$f(x)=\frac{3}{5}x -\frac{9}{5} - 2$$
$$f(x)=\frac{3}{5}x -\frac{9}{5} - \frac{10}{5}$$
$$f(x)=\frac{3}{5}x - \frac{19}{5}$$
Now we know the slope is $\frac{3}{5}$ and the initial value ($y$-intercept) is $-\frac{19}{5}$.
This is enough information to describe most of the features of the function.
- The rate of change is $\frac35$ (the slope).
- Since the slope is positive, the function is increasing on $(-\infty,\infty).$
- The domain and range are both (-\infty,\infty).
- Since the function is increasing, we know that as $x\to\infty,f(x)\to\infty$ and as $x\to-\infty,f(x)\to-\infty.$
We also readily know that the $y$-intercept is $-\frac{19}5,$ but we'll have to do a little work to find the $x$-intercept. Let's solve $f(x)=0$ to find it. $$\frac35 x - \frac{19}5 = 0$$ $$\frac35 x = \frac{19}5$$ $$x=\frac{19}3$$ So, the $x$-intercept is at $\frac{19}3$.
Working as an insurance salesperson, Ilya earns a base salary and a commission on each new policy, so Ilya’s weekly income, I, depends on the number of new policies, n, he sells during the week. Last week he sold 3 new policies, and earned \$760 for the week. The week before, he sold 5 new policies, and earned \$920. Find an equation for I(n), and interpret the meaning of the components of the equation.
The given information gives us two input-output pairs: (3,760) and (5,920). We start by finding the rate of change.
$$m=\frac{920 -760}{5 -3} = \frac{160}{2}=80$$
Keeping track of units can help us interpret this quantity. Income increased by \$160 when the number of policies increased by 2, so the rate of change is \$80 per policy; Ilya earns a commission of \$80 for each policy sold during the week.
Now we know the slope is $80$ and a point on the line is $(3, 760), $giving us the equation
$$I(n)=80(n−3)+760$$
This equation hides some important information, so let’s simplify it
$$I(n)=80n-240+760$$
$$I(n)=80n+520 $$
Now we can see the $y$-intercept is 520. This value is the starting value for the function. This is Ilya’s income when $n=0$, which means no new policies are sold. We can interpret this as Ilya’s base salary for the week, which does not depend upon the number of policies sold.
Our final interpretation is: Ilya’s base salary is \$520 per week and he earns an additional \$80 commission for each policy sold each week.
The balance in your college payment account, C, is a function of the number of quarters, q, you attend. Interpret the function $C(a)= – 4000q+2000$ in words. How many quarters of college can you pay for until this account is empty?
Given the table below write a linear equation that represents the table values
| w, number of weeks | 0 | 2 | 4 | 6 |
|---|---|---|---|---|
| P(w), number of rats | 1000 | 1080 | 1160 | 1240 |
We can see from the table that the initial value of rats is 1000 so in the linear format
$$P(w)=mw+b,$$ $$b=1000.$$
Rather than solving for m, we can notice from the table that the population goes up by 80 for every 2 weeks that pass. This rate is consistent from week 0, to week 2, 4, and 6. The rate of change is 80 rats per 2 weeks. This can be simplified to 40 rats per week and we can write
$$P(w)=mw+b$$ as $$P(w)=40w+1000.$$
If you didn’t notice this from the table you could still solve for the slope using any two points from the table. For example, using (2, 1080) and (6, 1240),
$$m=\frac{1240 -1080}{6 -2} = \frac{160}{4}=40\text{ rats per week}$$
Important Topics of this Section
Definition of Modeling
Definition of a linear function
Structure of a linear function
Increasing & Decreasing functions
Finding the slope/rate of change, m
Slope-intercept form of a line
Point-slope form of a line
Section 2.1 Exercises
Conceptual Questions
- What are the different forms of the equation of a line? When are each of the forms useful?
- How can we identify the slope of a line from an equation? From a graph? From two points?
- Consider a line in slope-intercept form. How is this form related to graphical transformations?
- Suppose we use a slope-intercept linear function to describe a real-world situation. What would each part of the function represent in that context?
- True or false: the slope of a linear function is always increasing or always decreasing.
- True or false: A linear function is neither concave up nor concave down.
- True or false: The slope is the only piece of information we need in order to write an equation for a linear function.
Practice Problems
A town's population has been growing linearly. In 2003, the population was 45,000, and the population has been growing by 1700 people each year. Write an equation,$ P(t), $ for the population t years after 2003.
A town's population has been growing linearly. In 2005, the population was 69,000, and the population has been growing by 2500 people each year. Write an equation,$ P(t), $ for the population t years after 2005.
Sonya is currently 10 miles from home, and is walking further away at 2 miles per hour. Write an equation for her distance from home t hours from now.
A boat is 100 miles away from the marina, sailing directly towards it at 10 miles per hour. Write an equation for the distance of the boat from the marina after t hours.
Timmy goes to the fair with \$40. Each ride costs \$2. How much money will he have left after riding n rides?
At noon, a barista notices she has $20 in her tip jar. If she makes an average of \$0.50 from each customer, how much will she have in her tip jar if she serves n more customers during her shift?
$P(t) = 1700t+45000$
$S(t) = 10+2t$
$T(n) = 40-2n$
Determine if each function is increasing or decreasing
$f(x)=4x+3$
$g(x)=5x+6$
$a(x)=5-2x$
$b(x)=8-3x$
$h(x)=-2x+4$
$k(x)=-4x+1$
$j(x)=\frac{1}{2}x-3$
$p(x)=\frac{1}{4}x-5$
$n(x)=-\frac{1}{3}x-2$
$m(x)=-\frac{3}{8}x+3$
Increasing
Decreasing
Decreasing
Increasing
Decreasing
Find the slope of the line that passes through the two given points
(2, 4) and (4, 10)
(1, 5) and (4, 11)
(-1,4) and (5, 2)
(-2, 8) and (4, 6)
(6,11) and (-4,3)
(9,10) and (-6,-12)
3
$- \frac{1}{3}$
$\frac{4}{5}$
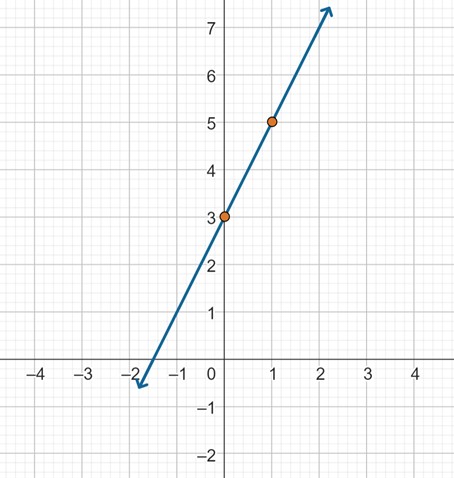
Find the slope of the lines graphed
$\frac{2}{3}$
Sonya is walking home from a friend’s house. After 2 minutes she is 1.4 miles from home. Twelve minutes after leaving, she is 0.9 miles from home. What is her rate?
A gym membership with two personal training sessions costs \$125, while gym membership with 5 personal training sessions costs \$260. What is the rate for personal training sessions?
A city's population in the year 1960 was 287,500. In 1989 the population was 275,900. Compute the slope of the population growth (or decline) and make a statement about the population rate of change in people per year.
A city's population in the year 1958 was 2,113,000. In 1991 the population was 2,099,800. Compute the slope of the population growth (or decline) and make a statement about the population rate of change in people per year.
A phone company charges for service according to the formula: $C(n)=24+0.1n$, where n is the number of minutes talked, and $C(n)$ is the monthly charge, in dollars.
Find and interpret the rate of change and initial value.A phone company charges for service according to the formula: $C(n)=26+0.04n$, where n is the number of minutes talked, and $C(n)$ is the monthly charge, in dollars.
Find and interpret the rate of change and initial value.Terry is skiing down a steep hill. Terry's elevation, $E(t)$, in feet after t seconds is given by $E(t)=3000-70t$. Write a complete sentence describing Terry’s starting elevation and how it is changing over time.
Maria is climbing a mountain. Maria's elevation, $E(t)$, in feet after t minutes is given by $E(t)= 1200+40t$. Write a complete sentence describing Maria’s starting elevation and how it is changing over time.
$S(t) = - \frac{1}{20}(x - 2) + 1.4$
The population is decreasing at a rate of about 400 people per year.
Rate of change: plan costs 10 cents per minutes; initial value: base charge for the plan is $24
Terry starts at an elevation of 3000 feet and descends at a rate of 70 feet per second.
Given each set of information, find a linear equation satisfying the conditions, if possible. Then describe the features of the function (rate of change, intervals of increasing/decreasing, domain and range, end behavior, and intercepts).
$f(−5) =- 4$, and $f(5) = 2$
$f(−1) = 4$, and $f(5) = 1$
Passes through (2, 4) and (4, 10)
Passes through (1, 5) and (4, 11)
Passes through (-1,4) and (5, 2)
Passes through (-2, 8) and (4, 6)
x intercept at (-2, 0) and y intercept at (0, -3)
x intercept at (-5, 0) and y intercept at (0, 4)
$f(x) = \frac{3}{5}(x + 5) - 4 = \frac{3}{5}x - 1$
$f(x) = 3(x−2)+4 = 3x-2$
$f(x) = - \frac{1}{3}(x + 1) + 4 = - \frac{1}{3}x + \frac{11}{3}$
$f(x) = - \frac{3}{2}x - 3$
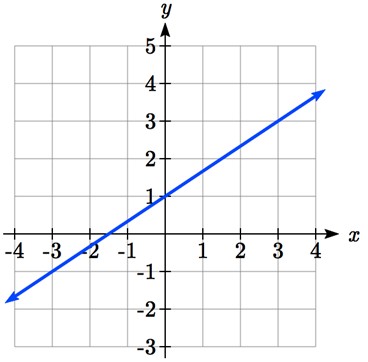
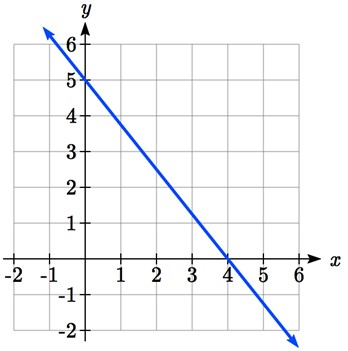
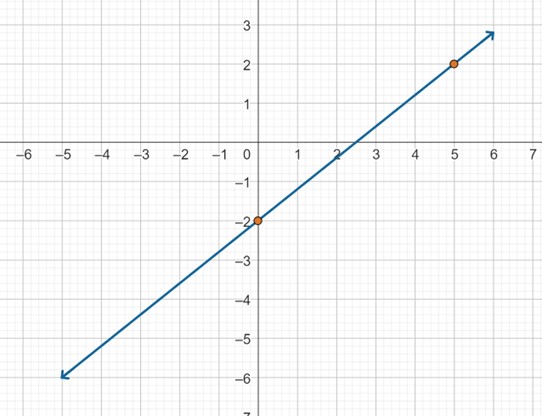
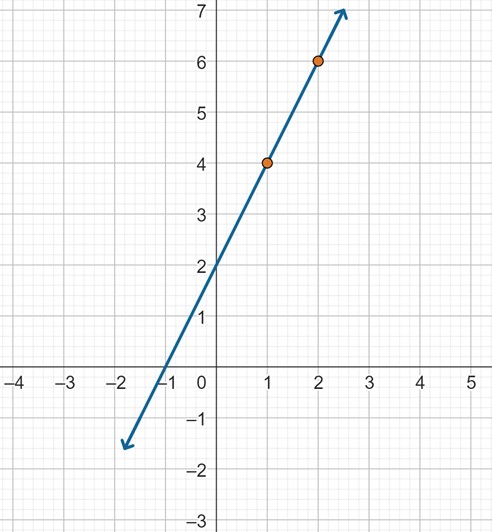
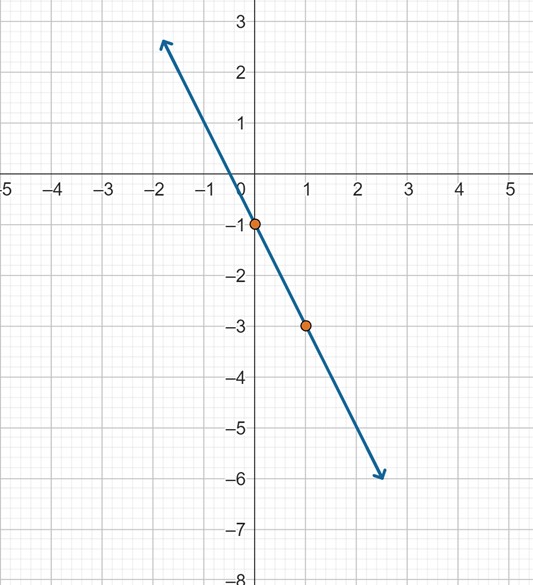
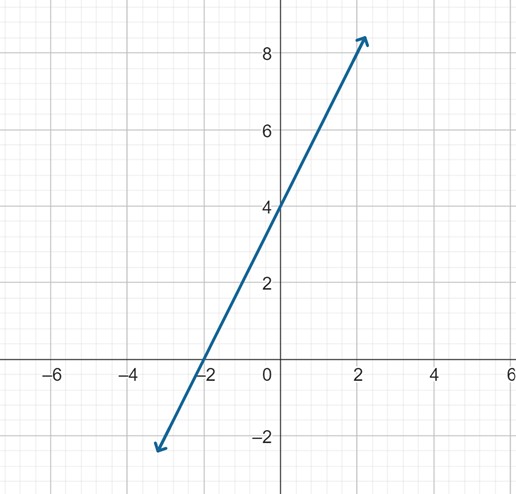
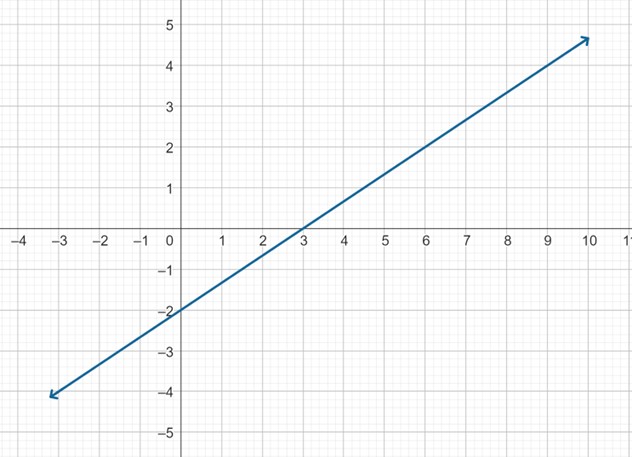
Find an equation for the function graphed


$f(x) = \frac{2}{3}x + 1$
$f(x) = -2x+3$
Graph each of the lines described by the following equations. Then describe the features of the function (rate of change, intervals of increasing/decreasing, domain and range, end behavior, and intercepts).
$f(x)=\frac{4}{5}x - 2$
$f(x)=3 - \frac{5}{4}x$
$f(x)=2(x−1)+4$
$g(x)=\ -\frac{1}{3}(x + 2) - 5$
$f(x)=-2x-1$
$g(x)=-3x+2$
$h(x)=\frac{1}{3}x + 2$
$k(x)=\frac{2}{3}x - 3$
$k(t)=3+2t$
$p(t)=-2+3t$
Rate of change: 4/5
Always increasing
Domain and Range $(−\infty,\infty)$
As $x \to \infty, f(x) \to \infty$ and as $x \to -\infty, f(x) \to -\infty$
$x$-intercept 5/2
$y$-intercept -2
Rate of change: 2
Always increasing
Domain and Range $(−\infty,\infty)$
As $x \to \infty, f(x) \to \infty$ and as $x \to -\infty, f(x) \to -\infty$
$x$-intercept -1
$y$-intercept 2
Rate of change: -2
Always decreasing
Domain and Range $(−\infty,\infty)$
As $x \to \infty, f(x) \to -\infty$ and as $x \to -\infty, f(x) \to \infty$
$x$-intercept -1/2
$y$-intercept -1

Rate of change: 1/3
Always increasing
Domain and Range $(−\infty,\infty)$
As $x \to \infty, f(x) \to \infty$ and as $x \to -\infty, f(x) \to -\infty$
$x$-intercept -6
$y$-intercept 2
Rate of change: 2
Always increasing
Domain and Range $(−\infty,\infty)$
As $x \to \infty, f(x) \to \infty$ and as $x \to -\infty, f(x) \to -\infty$
$x$-intercept -3/2
$y$-intercept 3
A clothing business finds there is a linear relationship between the number of shirts, n, it can sell and the price, p, it can charge per shirt. In particular, historical data shows that 1000 shirts can be sold at a price of \$30, while 3000 shirts can be sold at a price of \$22. Find a linear equation in the form $p=mn+b$ that gives the price p they can charge for n shirts.
$p = - \frac{1}{250}n + 34$
A farmer finds there is a linear relationship between the number of bean stalks, n, she plants and the yield, y, each plant produces. When she plants 30 stalks, each plant yields 30 oz of beans. When she plants 34 stalks, each plant produces 28 oz of beans. Find a linear relationships in the form $y=mn+b$ that gives the yield when n stalks are planted.
Which of the following tables could represent a linear function? For each that could be linear, find a linear equation models the data.
x g(x) 0 5 5 -10 10 -25 15 -40
x h(x) 0 5 5 30 10 105 15 230
x f(x) 0 -5 5 20 10 45 15 70
x k(x) 5 13 10 28 20 58 25 73
$g(x) = -3x+5$, $h$ is not linear, $f(x) = 5x-5$, $k(x) = 3(x−5)+13$
Which of the following tables could represent a linear function? For each that could be linear, find a linear equation models the data.
| x | g(x) |
|---|---|
| 0 | 6 |
| 2 | -19 |
| 4 | -44 |
| 6 | -69 |
| x | h(x) |
|---|---|
| 2 | 13 |
| 4 | 23 |
| 8 | 43 |
| 10 | 53 |
| x | f(x) |
|---|---|
| 2 | -4 |
| 4 | 16 |
| 6 | 36 |
| 8 | 56 |
| x | k(x) |
|---|---|
| 0 | 6 |
| 2 | 31 |
| 6 | 106 |
| 8 | 231 |
While speaking on the phone to a friend in Oslo, Norway, you learned that the current temperature there was -23 Celsius (-23oC). After the phone conversation, you wanted to convert this temperature to Fahrenheit degrees, oF, but you could not find a reference with the correct formulas. You then remembered that the relationship between oF and oC is linear. [UW]
Using this and the knowledge that 32oF=0 oC and 212 oF=100 oC, find an equation that computes Celsius temperature in terms of Fahrenheit; i.e. an equation of the form C=“an expression involving only the variable F.”
Likewise, find an equation that computes Fahrenheit temperature in terms of Celsius temperature; i.e. an equation of the form F=“an expression involving only the variable C.”
How cold was it in Oslo in oF?
(a) $C = \frac{5}{9}(F - 32)$; (b) $F = \frac{9}{5}C + 32$; (c) $-9.4^{∘}$ F
Sketch a line with the given features
An x-intercept of (-4, 0) and y-intercept of (0, -2)
An x-intercept of (-2, 0) and y-intercept of (0, 4)
A vertical intercept of (0, 7) and slope $-\frac{3}{2}$
A vertical intercept of (0, 3) and slope $\frac{2}{5}$
Passing through the points (-6,-2) and (6,-6)
Passing through the points (-3,-4) and (3,0)
If $g(x)$ is the transformation of $f(x)=x$ after a vertical compression by $3/4$, a shift left by 2, and a shift down by 4
Write an equation for $g(x)$
What is the slope of this line?
Find the vertical intercept of this line.
If $g(x)$ is the transformation of $f(x)=x$ after a vertical compression by $1/3$, a shift right by 1, and a shift up by 3
Write an equation for $g(x)$
What is the slope of this line?
Find the vertical intercept of this line.
(a) $g(x) = \frac{1}{3}(x - 1) + 3$; (b) $\frac{1}{3}$; (c) 8/3
Find the horizontal and vertical intercepts of each equation
$f(x)=-x+2$
$g(x)=2x+4$
$h(x)=3x-5$
$k(x)=-5x+1$
$-2x+5y=20$
$7x+2y=56$
$x:$ -2, $y:$ 4
$x:$ 1/5, $y:$ 1
$x: $5/7; $y:$ 5/2
Find a formula for ease piecewise defined function.
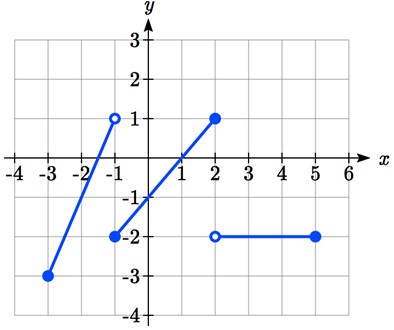
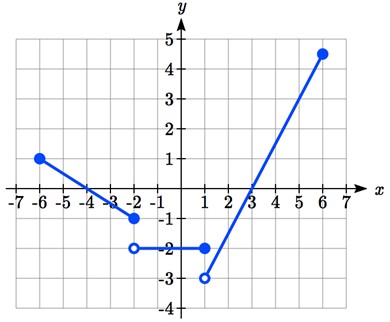
$f(x) = \ \left\{ \begin{array}{r} - \frac{1}{2}x - 2\ \ \ \text{ if } - 6 \leq x \leq - 2 \\ - 2\ \ \ \ \ \text{ if } - 2 \lt x \leq 1 \\ \frac{3}{2}x - \frac{9}{2}\ \ \ \ \ \text{ if }\ 1 \lt x \leq 6 \end{array} \right.\ $
Nevada Taxicab Authority, retrieved Aug 4, 2020. There is also a waiting fee assessed when the taxi is waiting at red lights, but we’ll ignore that in this discussion.↩︎
http://www.thesimpledollar.com/2009/06/19/rule-1-spend-less-than-you-earn/↩︎