Section 5.3: Graphs of Sine and Cosine
Learning Objectives
In this section you will:
- Describe how transformations affect the graphs of functions.
- Create Parent Tables and Graphs for Sine and Cosine functions.
- Graph Sine and Cosine Functions using transformations.
Describe how transformations affect the graphs of functions.
Before we concern ourselves with the graphs of the circular functions, let's refresh our skills of graphical transformations. Our motivational example for the results in this section is the graph of $y = f(x)$ below. While we could formulate an expression for $f(x)$ as a piecewise-defined function consisting of linear and constant parts, we wish to focus more on the geometry here. That being said, we do record some of the function values - the `key points' if you will - to track through each transformation.
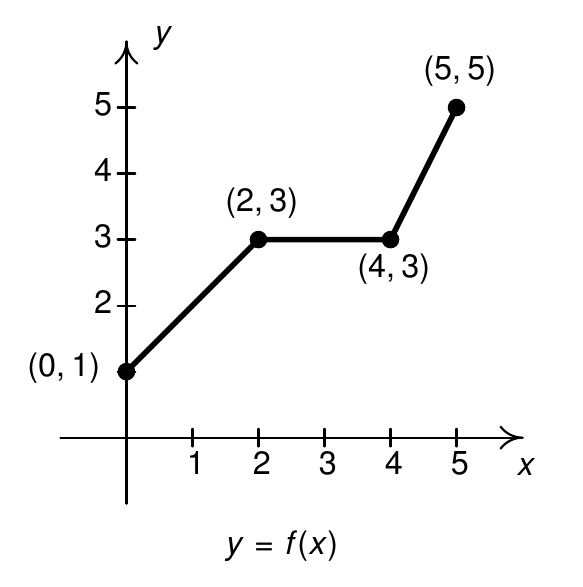
| $x$ | $y=f(x)$ |
|---|---|
| $0$ | $1$ |
| $2$ | $3$ |
| $4$ | $3$ |
| $5$ | $5$ |
| $(x,f(x))$ |
|---|
| $(0,1)$ |
| $(2,3)$ |
| $(4,3)$ |
| $(5,5)$ |
Vertical and Horizontal Shifts
Suppose we wished to graph $g(x) = f(x) + 2$. From a procedural point of view, we start with an input $x$ to the function $f$ and we obtain the output $f(x)$. The function $g$ takes the output $f(x)$ and adds $2$ to it. Using the sample values for $f$ from the table above we can create a table of values for $g$ below, hence generating points on the graph of $g$.
| $x$ | $f(x)\rightarrow$ | $g(x)=f(x) + 2$ | $(x, g(x))$ | |
|---|---|---|---|---|
| $0$ | $1$ | $1+2=3$ | $(0, 3)$ | |
| $2$ | $3$ | $3 + 2=5$ | $(2, 5)$ | |
| $4$ | $3$ | $3 + 2=5$ | $(4, 5)$ | |
| $5$ | $5$ | $5 + 2=7$ | $(5, 7)$ |
In general, if $(a,b)$ is on the graph of $y=f(x)$, then $f(a) = b$. Hence, $g(a) = f(a) +2 = b+2$, so the point $(a,b+2)$ is on the graph of $g$. In other words, to obtain the graph of $g$, we add $2$ to the $y$-coordinate of each point on the graph of $f$.
To get a feel for what's happening here, you can adjust the slider labelled "d" in the following interactive demonstration. Consider the following: as d becomes larger, how does the graph change? What about as d becomes smaller (more negative)?
Made with Geogebra
Slide slider d to 2, and you'll see that geometrically, adding $2$ to the $y$-coordinate of a point moves the point $2$ units above its previous location. Adding $2$ to every $y$-coordinate on a graph en masse is moves or `shifts' the entire graph of $f$ up $2$ units. Notice that the graph retains the same basic shape as before, it is just $2$ units above its original location. In other words, we connect the four `key points' we moved in the same manner in which they were connected before.
You'll note that the domain of $f$ and the domain of $g$ are the same, namely $[0,5]$, but that the range of $f$ is $[1,5]$ while the range of $g$ is $[3,7]$. In general, shifting a function vertically like this will leave the domain unchanged, but could very well affect the range.
You can easily imagine what would happen if we wanted to graph the function $j(x) = f(x) - 2$. Instead of adding $2$ to each of the $y$-coordinates on the graph of $f$, we'd be subtracting $2$. Geometrically, we would be moving the graph down $2$ units. We leave it to the reader to verify that the domain of $j$ is the same as $f$, but the range of $j$ is $[-1,3]$. In general, we have:
Vertical Shifts
Suppose $f$ is a function and $d$ is a real number.
To graph $F(x) = f(x) + d$, add $d$ to each of the $y$-coordinates of the points on the graph of $y=f(x)$.
NOTE: This results in a vertical shift up $d$ units if $d \gt 0$ or down $d$ units if $d \lt 0$.
Keeping with the graph of $y=f(x)$ above, suppose we wanted to graph $g(x) = f(x+2)$. In other words, we are looking to see what happens when we add $2$ to the input of the function. Let's try to generate a table of values of $g$ based on those we know for $f$. We quickly find that we run into some difficulties. For instance, when we substitute $x=4$ into the formula $g(x)=f(x+2)$, we are asked to find $f(4+2)=f(6)$ which doesn't exist because the domain of $f$ is only $[0,5]$. The same thing happens when we attempt to find $g(5)$.
| $x$ | $f(x)$ | $g(x)=f(x+2)$ | $(x,g(x))$ | |
|---|---|---|---|---|
| $0 $ | $1$ | $g(0)=f(0+2)=f(2)=3$ | $(0,3)$ | |
| $2 $ | $3 $ | $g(2)=f(2+2)=f(4)=3$ | $(2,3)$ | |
| $4 $ | $3$ | $g(4)=f(4+2)=f(6)=?$ | ? | |
| $5 $ | $5$ | $g(5)=f(5+2)=f(7)=? $ | ? |
What we need here is a new strategy. We know, for instance, $f(0) = 1$. To determine the corresponding point on the graph of $g$, we need to figure out what value of $x$ we must substitute into $g(x) = f(x+2)$ so that the quantity $x+2$, works out to be $0$. Solving $x+2=0$ gives $x=-2$, and $g(-2) = f((-2)+2) = f(0) = 1$ so $(-2,1)$ on the graph of $g$.
Similarly, to use the fact $f(2) = 3$, we set $x+2 = 2$ to get $x=0$. Substituting gives $g(0) = f(0+2) = f(2) = 3$. Continuing in this fashion, we produce the table below.
| $x $ | $ x+2 $ | $ g(x)=f(x+2) $ | $ (x, g(x))$ | |
|---|---|---|---|---|
| $-2 $ | $ 0 $ | $ g(-2)=f(-2+2)=f(0)=1 $ | $(-2, 1)$ | |
| $0 $ | $ 2 $ | $ g(0)=f(0+2)=f(2)=3 $ | $(0,3)$ | |
| $2 $ | $ 4 $ | $ g(2)=f(2+2)=f(4)=3 $ | $ (2,3)$ | |
| $3 $ | $ 5 $ | $ g(3)=f(3+2)=f(5)=5 $ | $ (3,5)$ |
In summary, the points $(0,1)$, $(2,3)$, $(4,3)$ and $(5,5)$ on the graph of $y=f(x)$ give rise to the points $(-2,1)$, $(0,3)$, $(2,3)$ and $(3,5)$ on the graph of $y=g(x)$, respectively.
In general, if $(a,b)$ is on the graph of $y=f(x)$, then $f(a) = b$. Solving $x+2 = a$ gives $x = a-2$ so that $g(a-2) = f((a-2)+2) = f(a) = b$. As such, $(a-2,b)$ is on the graph of $y=g(x)$. The point $(a-2,b)$ is exactly $2$ units to the left of the point $(a,b)$ so the graph of $y=g(x)$ is obtained by shifting the graph $y=f(x)$ to the left $2$ units. To get a feel for this, in the following demonstration, adjust the slider labelled c.
Made with Geogebra
Investigate what happens when $c$ is positive versus negative. It seems counterintuitive at first, but a positive $c$ value shifts the graph left while a negative $c$ value shifts the graph right!
Note that while the ranges of $f$ and $g$ are the same, the domain of $g$ is $[-2,3]$ whereas the domain of $f$ is $[0,5]$. In general, when we shift the graph horizontally, the range will remain the same, but the domain could change. If we set out to graph $j(x) = f(x-2)$, we would find ourselves adding $2$ to all of the $x$ values of the points on the graph of $y=f(x)$ to effect a shift to the right $2$ units. Generalizing these notions produces the following result.
Horizontal Shifts
Suppose $f$ is a function and $c$ is a real number.
To graph $F(x) = f(x+c)$, subtract $c$ from each of the $x$-coordinates of the points on the graph of $y=f(x)$.
Note: This results in a horizontal shift right $c$ units if $c \lt 0$ or left $c$ units if $c \gt 0$.
These observations about vertical and horizontal shifts present a theme which will run common throughout the section: changes to the outputs from a function result in some kind of vertical change; changes to the inputs to a function result in some kind of horizontal change.
For more examples and explanations, check out our sister College Algebra text.
Reflections about the Coordinate Axes
We now turn our attention to reflections. You may know from algebra courses that to reflect a point $(x,y)$ across the $x$-axis, we replace $y$ with $-y$. If $(x,y)$ is on the graph of $f$, then $y=f(x)$, so replacing $y$ with $-y$ is the same as replacing $f(x)$ with $-f(x)$. Hence, the graph of $y=-f(x)$ is the graph of $f$ reflected across the $x$-axis. Similarly, the graph of $y=f(-x)$ is the graph of $y = f(x)$ reflected across the $y$-axis. To get a feel for this, in the following demonstration, adjust the sliders labelled a and b.
Made with Geogebra
Reflections
Suppose $f$ is a function.
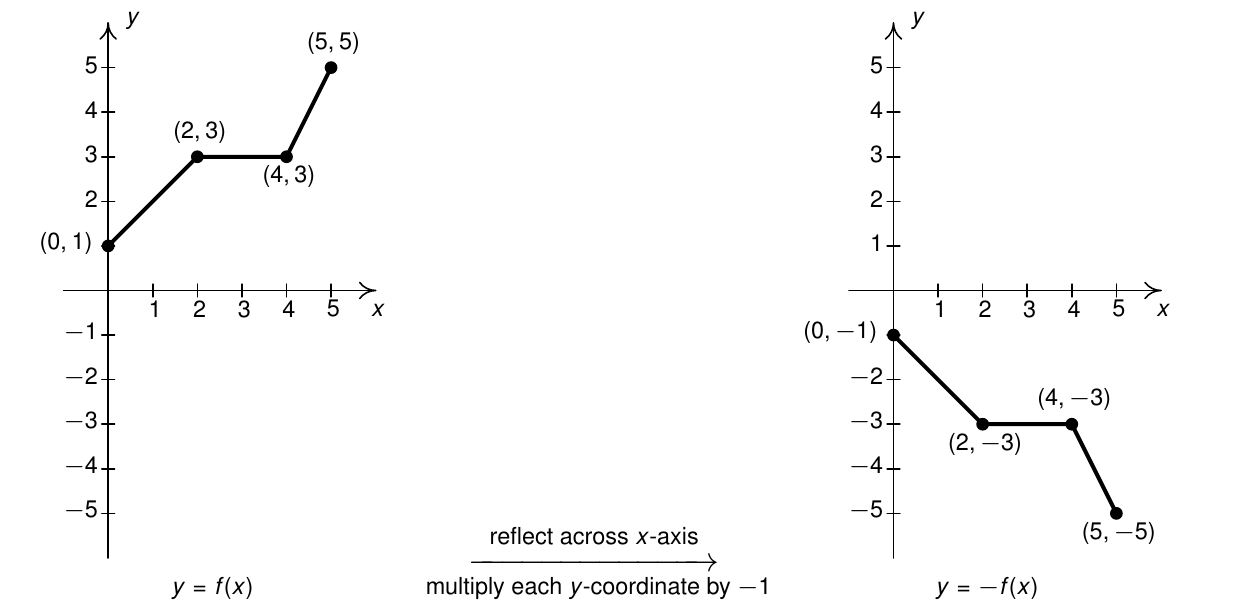
To graph $F(x)=-f(x)$, multiply each of the $y$-coordinates of the points on the graph of $y=f(x)$ by $-1$.
NOTE: This results in a reflection across the $x$-axis.
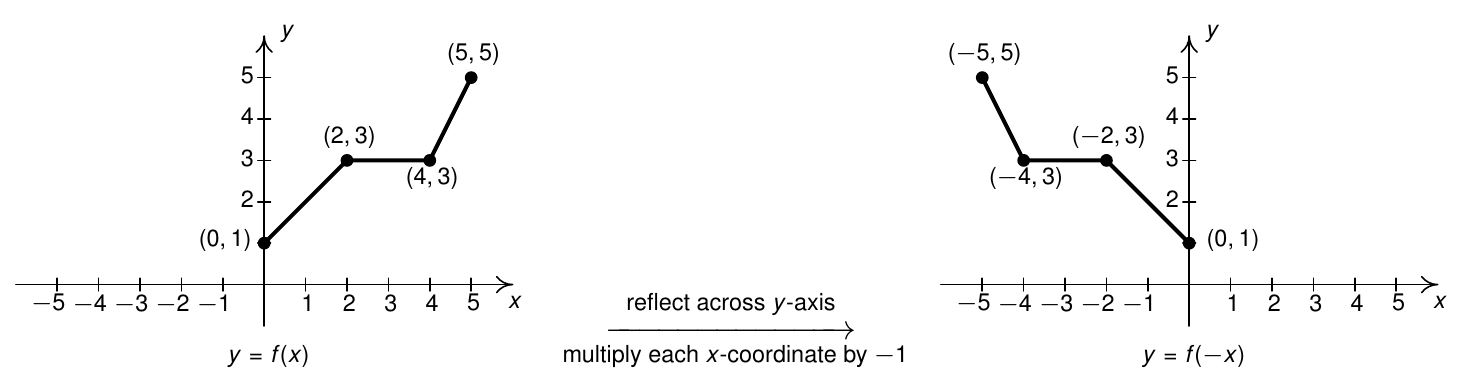
To graph $F(x)=f(-x)$, multiply each of the $x$-coordinates of the points on the graph of $y=f(x)$ by $-1$.
NOTE: This results in a reflection across the $y$-axis.
Using the language of inputs and outputs, we are saying that multiplying the outputs from a function by $-1$ reflects its graph across the horizontal axis, while multiplying the inputs to a function by $-1$ reflects the graph across the vertical axis.
Applying these ideas to the graph of $y=f(x)$ given at the beginning of the section, we can graph $y=-f(x)$ by reflecting the graph of $f$ about the $x$-axis.
| $x $ | $ y=f(x) $ | $ g(x)=-1\cdot y$ | $(x,g(x))$ | |
|---|---|---|---|---|
| $0 $ | $ 1 $ | $ -1 $ | $(0,-1)$ | |
| $2 $ | $ 3 $ | $ -3 $ | $(2,-3)$ | |
| $4 $ | $ 3 $ | $ -3 $ | $(4,-3)$ | |
| $5 $ | $ 5 $ | $ -5 $ | $(5,-5)$ |
By reflecting the graph of $f$ across the $y$-axis, we obtain the graph of $y=f(-x)$.
| $x $ | $ -x $ | $ g(x)=f(-x)$ | $(x,g(x))$ | |
|---|---|---|---|---|
| $0 $ | $ 0 $ | $ g(0)=f(-(-0))=f(0)=1 $ | $(0,1)$ | |
| $-2 $ | $ 2 $ | $ g(-2)=f(-(-2))=f(2)=3 $ | $(-2,3)$ | |
| $-4 $ | $ 4 $ | $ g(-4)=f(-(-4))=f(4)=3 $ | $(-4,3)$ | |
| $-5 $ | $ 5 $ | $ g(-5)=f(-(-5))=f(5)=5 $ | $(-5,5)$ |
Scalings
We now turn our attention to our last class of transformations: scalings. A thorough discussion of scalings can get complicated because they are not as straight-forward as the previous transformations. A quick review of what we've covered so far, namely vertical shifts, horizontal shifts and reflections, will show you why those transformations are known as rigid transformations.
Simply put, rigid transformations preserve the distances between points on the graph - only their position and orientation in the plane change. If, however, we wanted to make a new graph twice as tall as a given graph, or one-third as wide, we would be affecting the distance between points. These sorts of transformations are hence called non-rigid. As always, we motivate the general theory with an example.
Suppose we wish to graph the function $g(x) =2 f(x)$ where $f(x)$ is the function whose graph is given at the beginning of the section. From its graph, we can build a table of values for $g$ as before.
| $x $ | $ f(x) $ | $ g(x)=2f(x)$ |
|---|---|---|
| $0 $ | $ 1 $ | $ 2 $ |
| $2 $ | $ 3 $ | $ 6 $ |
| $4 $ | $ 3 $ | $ 6 $ |
| $5 $ | $ 5 $ | $ 10 $ |
| $(x, g(x))$ |
|---|
| $(0, 2)$ |
| $(2, 6)$ |
| $(4, 6)$ |
| $(5, 10)$ |
Graphing, we get:

To get a feel for this, in the following demonstration, adjust the sliders labelled a.
Made with Geogebra
In general, if $(a,b)$ is on the graph of $f$, then $f(a) = b$ so that $g(a) = 2 f(a) = 2b$ puts $(a,2b)$ on the graph of $g$. In other words, to obtain the graph of $g$, we multiply all of the $y$-coordinates of the points on the graph of $f$ by $2$. Multiplying all of the $y$-coordinates of all of the points on the graph of $f$ by $2$ causes what is known as a `vertical scaling by a factor of $2$.'
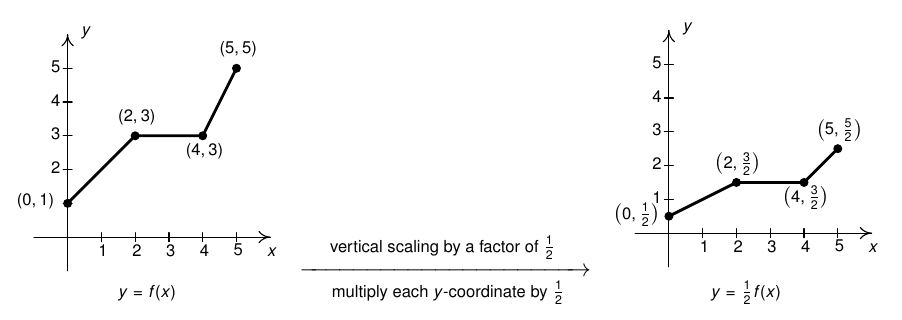
If we wish to graph $y = \frac{1}{2} f(x)$, we multiply the all of the $y$-coordinates of the points on the graph of $f$ by $\frac{1}{2}$. This creates a `vertical scaling by a factor of $\frac{1}{2}$' as seen below.
We generalize these results below.
Vertical Scalings.
Suppose $f$ is a function and $a>0$ is a real number.
To graph $F(x) = af(x)$, multiply each of the $y$-coordinates of the points on the graph of $y=f(x)$ by $a$.
- If $a \gt 1$, we say the graph of $f$ has undergone a vertical stretch by a factor of $a$.
- If $0 \lt a \lt 1$, we say the graph of $f$ has undergone a vertical shrink by a factor of $\frac{1}{a}$.
Referring to the graph of $f$ given at the beginning of this section, suppose we want to graph $g(x) = f(2x)$. In other words, we are looking to see what effect multiplying the inputs to $f$ by $2$ has on its graph. If we attempt to build a table directly, we quickly run into the same problem we had in our discussion leading up to our horizontal shifts, as seen in the following table.
| $x $ | $ f(x)$ | $ g(x)=f(2x) $ | $ (x, g(x)) $ |
|---|---|---|---|
| $0 $ | $ 1 $ | $ f(2 \cdot 0)=f(0)=1 $ | $(0, 1) $ |
| $2 $ | $ 3 $ | $ f(2\cdot2)=f(4)=3 $ | $(2,3) $ |
| $4 $ | $ 3 $ | $ f(2 \cdot 4)=f(8)=? $ | $ $ |
| $5 $ | $ 5 $ | $ f(2 \cdot 5)=f(10)=? $ | $ $ |
We solve this problem in the same way we solved this problem before. For example, if we want to determine the point on $g$ which corresponds to the point $(2,3)$ on the graph of $f$, we set $2x =2 $ so that $x=1$. Substituting $x=1$ into $g(x)$, we obtain $g(1)=f(2 \cdot 1)=f(2)=3$, so that $(1,3)$ is on the graph of $g$.
In general, if $(a,b)$ is on the graph of $f$, then $f(a)=b$. Hence $g\left(\frac{a}{2}\right)=f\left(2 \cdot \frac{a}{2}\right)=f(a)=b$ so that $\left(\frac{a}{2}, b\right)$ is on the graph of $g$. In other words, to graph $g$ we divide the $x$-coordinates of the points on the graph of $f$ by $2$. This results in a horizontal scaling by a factor of $\frac{1}{2}$.
| $X=\frac{x}2 $ | $ x $ | $ g(X)=f(2X)=f(x) $ | $ (X, g(X)) $ | |
| $0 $ | $ 0 $ | $ g(0)= f(2 \cdot 0)=f(0)=1 $ | $(0, 1) $ | |
| $1 $ | $ 2 $ | $ g(1)=f(2 \cdot 1)=f(2) =3 $ | $(1,3) $ | |
| $2 $ | $ 4 $ | $ g(2)=f(2 \cdot 2)=f(4)=3 $ | $ (2,3)$ | |
| $\frac{5}{2} $ | $ 5 $ | $ g\left(\frac{5}{2}\right)=f\left(2 \cdot \frac{5}{2} \right)=f(5)=5 $ | $\left(\frac{5}{2},5\right) $ |
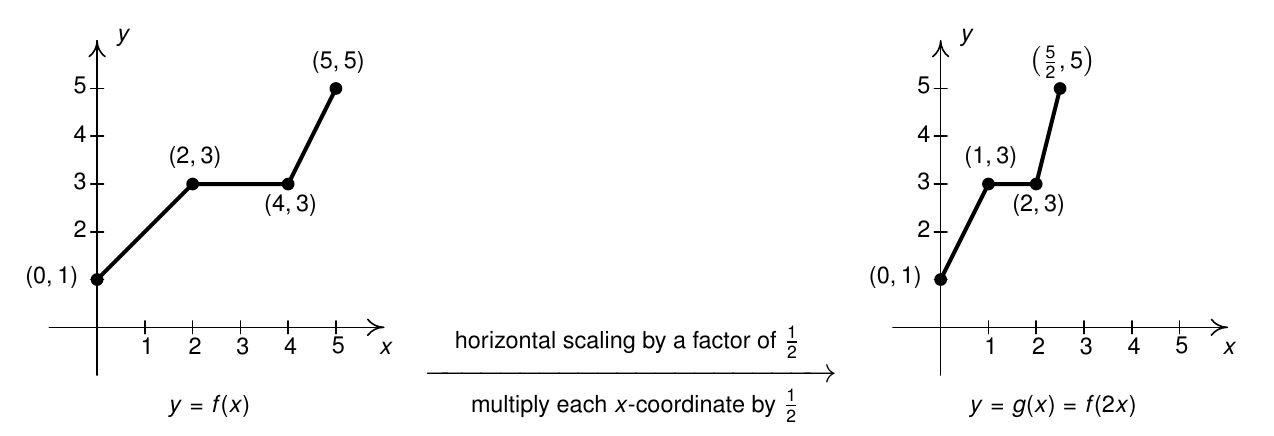
To get a feel for this, in the following demonstration, adjust the slider labelled b.
Made with Geogebra
If, on the other hand, we wish to graph $y = f\left( \frac{1}{2} x\right)$, we end up multiplying the $x$-coordinates of the points on the graph of $f$ by $2$ which results in a horizontal scaling by a factor of $2$, as demonstrated below.
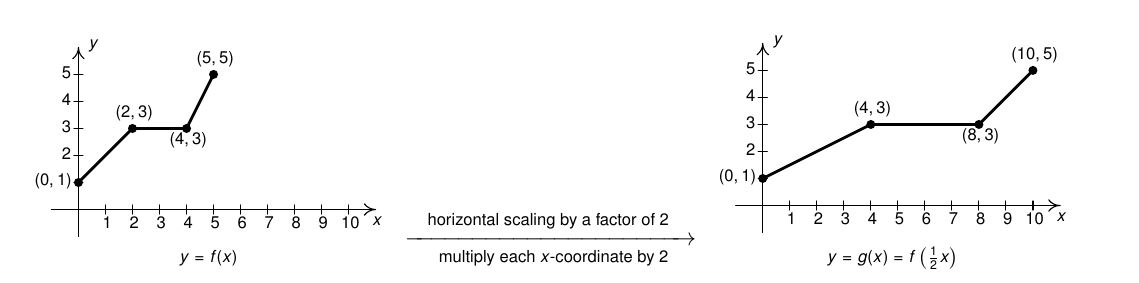
We generalize these results below.
Horizontal Scalings.
Suppose $f$ is a function and $b>0$ is a real number.
To graph $F(x) = f(bx)$, divide each of the $x$-coordinates of the points on the graph of $y=f(x)$ by $b$.
- If $0 \lt b \lt 1$, we say the graph of $f$ has undergone a horizontal stretch by a factor of $\frac{1}{b}$.
- If $b \gt 1$, we say the graph of $f$ has undergone a horizontal shrink by a factor of $b$.
Transformations in Sequence
Now that we have studied three basic classes of transformations: shifts, reflections, and scalings, we present a result below which provides one algorithm to follow to transform the graph of $y=f(x)$ into the graph of $y=af(bx+c)+d$.
Transformations in Sequence.
Suppose $f$ is a function. If $a, b \neq 0$, then to graph $g(x) = a f(bx+c)+d$ start with the graph of $y=f(x)$ and follow the steps below.
- Subtract c from each of the $x$-coordinates of the points on the graph of $f$.
- Divide the $x$-coordinates of the points on the graph obtained in Step 1 by $b$.
- Multiply the $y$-coordinates of the points on the graph obtained in Step 2 by $a$.
- Add $d$ to each of the $y$-coordinates of the points on the graph obtained in Step 3.
NOTE: This results in a horizontal shift to the left if $c \lt 0$ or right if $c \gt 0$.
NOTE: This results in a horizontal scaling, but includes a reflection about the $y$-axis if $b \lt 0$.
NOTE: This results in a vertical scaling, but includes a reflection about the $x$-axis if $a \lt 0$.
NOTE: This results in a vertical shift up if $d \gt 0$ or down if $d \lt 0$.
A convenient way to remember this order is "C-BAD".
That's a good amount of "review" to be sure. We'll get plenty of practice using these techniques once we develop the parent graphs and tables for the sine and cosine functions.
Graphing the Sine and Cosine Functions
In this chapter, we discussed how to interpret the sine and cosine of real numbers. To review, we identify a real number $t$ with an oriented angle $\theta$ measuring $t$ radians and define $\sin(t) = \sin(\theta)$ and $\cos(t) = \cos(\theta)$. Since every real number can be identified with one and only one angle $\theta$ this way, the domains of the functions $f(t) = \sin(t)$ and $g(t) = \cos(t)$ are all real numbers, $(-\infty, \infty)$.
When it comes to range, recall that the sine and cosine of angles are coordinates of points on the Unit Circle and hence, each fall between $-1$ and $1$ inclusive. Since the real number line, when wrapped around the Unit Circle completely covers the circle, we can be assured that every point on the Unit Circle corresponds to at least one real number. Putting these two facts together, we conclude the range of $f(t) = \sin(t)$ and $g(t) = \cos(t)$ are both $[-1,1]$. We summarize these two important facts below.
Domain and Range of the Cosine and Sine Functions:
The functions $f(t) = \sin(t)$ and $f(t) = \cos(t)$ have domain $(-\infty, \infty)$ and range $[-1,1]$.
Our aim in this section is to become familiar with the graphs of $f(t) = \sin(t)$ and $g(t) = \cos(t)$. To that end, we begin by making a table and plotting points. We'll start by graphing $f(t) = \sin(t)$ by making a table of values and plotting the corresponding points. We'll keep the independent variable `$t$' for now and use the default `$y$' as our dependent variable. Keep in mind that we're using `$y$' here to denote the output from the sine function. It is a coincidence that the $y$-values on the graph of $y=\sin(t)$ correspond to the $y$-values on the Unit Circle. Note in the graph below, the scale of the horizontal and vertical axis is far from 1:1. (We will present a more accurately scaled graph shortly.)
| $ t $ | $ \sin(t) $ | $ (t,\sin(t)) $ | |
|---|---|---|---|
| $0 $ | $ 0 $ | $ (0, 0) $ | |
| $\frac{\pi}{4} $ | $ \frac{\sqrt{2}}{2} $ | $ \left(\frac{\pi}{4}, \frac{\sqrt{2}}{2}\right) $ | |
| $\frac{\pi}{2} $ | $ 1 $ | $ \left(\frac{\pi}{2}, 1\right) $ | |
| $\frac{3\pi}{4} $ | $ \frac{\sqrt{2}}{2} $ | $ \left(\frac{3\pi}{4}, \frac{\sqrt{2}}{2}\right) $ | |
| $\pi $ | $ 0 $ | $ (\pi, 0) $ | |
| $\frac{5\pi}{4} $ | $ -\frac{\sqrt{2}}{2} $ | $ \left(\frac{5\pi}{4}, -\frac{\sqrt{2}}{2}\right) $ | |
| $\frac{3\pi}{2} $ | $ -1 $ | $ \left(\frac{3\pi}{2}, -1 \right) $ | |
| $\frac{7\pi}{4} $ | $ -\frac{\sqrt{2}}{2} $ | $ \left(\frac{7\pi}{4}, -\frac{\sqrt{2}}{2}\right) $ | |
| $2\pi $ | $ 0 $ | $ (2\pi, 0) $ |
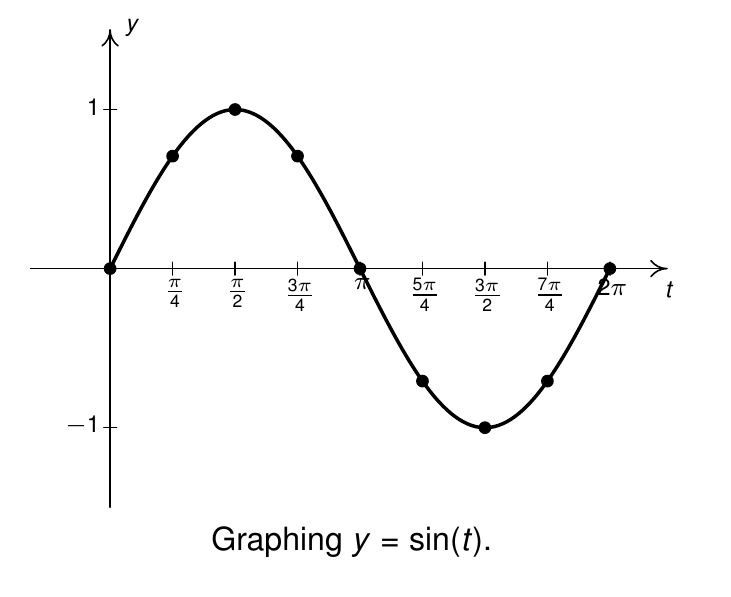
If we plot additional points, we soon find that the graph repeats itself. In fact, we expect the function to repeat itself every $2\pi$ units. Below is a more accurately scaled graph highlighting the portion we had already graphed above. The graph is often described as having a `wavelike' nature and is sometimes called a sine wave or, more technically, a sinusoid.

Note that by copying the highlighted portion of the graph and pasting it end-to-end, we obtain the entire graph of $f(t) = \sin(t)$. We give this `repeating' property a name.
Periodic Functions
A function $f$ is said to be periodic if there is a real number $c$ so that $f(t+c) = f(t)$ for all real numbers $t$ in the domain of $f$. The smallest positive number $p$ for which $f(t+p) = f(t)$ for all real numbers $t$ in the domain of $f$, if it exists, is called the period of $f$.
We know that $\sin(t + 2\pi) = \sin(t)$ for all real numbers $t$ but the question remains if any smaller real number will do the trick. Suppose $p\gt0$ and $\sin(t + p) = \sin(t)$ for all real numbers $t$. Then, in particular, $\sin(0+p) = \sin(0)=0$ so that $\sin(p) = 0$. From this we know $p$ is a multiple of $\pi$. Since $\sin\left(\frac{\pi}{2} \right) \neq \sin\left(\frac{\pi}{2} + \pi \right) $, we know $p \neq \pi$. Hence, $p = 2\pi$ so the period of $f(t) = \sin(t)$ is $2\pi$.
Having period $2\pi$ essentially means that we can completely understand everything about the function $f(t) = \sin(t)$ by studying one interval of length $2\pi$, say $[0,2\pi]$. For this reason, when graphing sine (and cosine) functions, we typically restrict our attention to graphing these functions over the course of one period to produce one cycle of the graph.
Not surprisingly, the graph of $g(t) = \cos(t)$ exhibits similar behavior as $f(t) = \sin(t)$ as seen below. Here note that the dependent variable `$y$' represents the outputs from $g(t) = \cos(t)$ which are $x$-coordinates on the Unit Circle.
| $t $ | $ \cos(t) $ | $ (t,\cos(t)) $ | |
| $0 $ | $ 1 $ | $ (0, 1) $ | |
| $\frac{\pi}{4} $ | $ \frac{\sqrt{2}}{2} $ | $ \left(\frac{\pi}{4}, \frac{\sqrt{2}}{2}\right) $ | |
| $\frac{\pi}{2} $ | $ 0 $ | $ \left(\frac{\pi}{2}, 0\right) $ | |
| $\frac{3\pi}{4} $ | $ -\frac{\sqrt{2}}{2} $ | $ \left(\frac{3\pi}{4}, -\frac{\sqrt{2}}{2}\right) $ | |
| $\pi $ | $ -1 $ | $ (\pi, -1) $ | |
| $\frac{5\pi}{4} $ | $ -\frac{\sqrt{2}}{2} $ | $ \left(\frac{5\pi}{4}, -\frac{\sqrt{2}}{2}\right) $ | |
| $\frac{3\pi}{2} $ | $ 0 $ | $ \left(\frac{3\pi}{2}, 0 \right) $ | |
| $\frac{7\pi}{4} $ | $ \frac{\sqrt{2}}{2} $ | $ \left(\frac{7\pi}{4}, \frac{\sqrt{2}}{2}\right) $ | |
| $2\pi $ | $ 1 $ | $ (2\pi, 1) $ |

Like $f(t)=\sin(t)$, $g(t) = \cos(t)$ is a wavelike curve with period $2\pi$. Moreover, the graphs of the sine and cosine functions have the same shape - differing only in what appears to be a horizontal shift. As we'll prove in a later section, $\sin\left(t + \frac{\pi}{2}\right) = \cos(t)$, which means we can obtain the graph of $y=\cos(t)$ by shifting the graph of $y=\sin(t)$ to the left $\frac{\pi}{2}$ units. Hence, we can obtain the graph of $y = \sin(t)$ by shifting the graph of $y = \cos(t)$ to the right $\frac{\pi}{2}$ units: $\cos\left(t - \frac{\pi}{2} \right) = \sin(t)$.

While arguably the most important property shared by $f(t) = \sin(t)$ and $g(t) = \cos(t)$ is their periodic `wavelike' nature (this is the reason they are so useful in the Sciences and Engineering) their graphs suggest these functions are both continuous and smooth. Like polynomial functions, the graphs of the sine and cosine functions have no jumps, gaps, holes in the graph, vertical asymptotes, corners or cusps.
Moreover, the graphs of both $f(t) = \sin(t)$ and $g(t) = \cos(t)$ meander and never `settle down' as $t \rightarrow \pm \infty$ to any one real number. So even though these functions are `trapped' (or bounded) between $-1$ and $1$, neither graph has any horizontal asymototes.
Lastly, the graphs of $f(t) = \sin(t)$ and $g(t) = \cos(t)$ suggest each enjoy one of the symmetries of functions. The graph of $y = \sin(t)$ appears to be symmetric about the origin while the graph of $y = \cos(t)$ appears to be symmetric about the $y$-axis. Indeed, as we'll prove in a later section, $f(t) = \sin(t)$ is, in fact, an odd function: that is, $\sin(-t) = -\sin(t)$ and $g(t) = \cos(t)$ is an even function, so $\cos(-t) = \cos(t)$.
We summarize all of these properties in the following result.
Properties of the Cosine and Sine Functions
The function $f(t) = \sin(t)$...
- has domain $(-\infty, \infty)$
- has range $[-1,1]$
- is odd (so $\sin(-t) = -\sin(t)$)
- has no breaks or sharp edges
- has period $2\pi$
The function $f(t) = \cos(t)$...
- has domain $(-\infty, \infty)$
- has range $[-1,1]$
- is even (so $\cos(-t) = \cos(t)$)
- has no breaks or sharp edges
- has period $2\pi$
Graph Sine and Cosine Functions using transformations
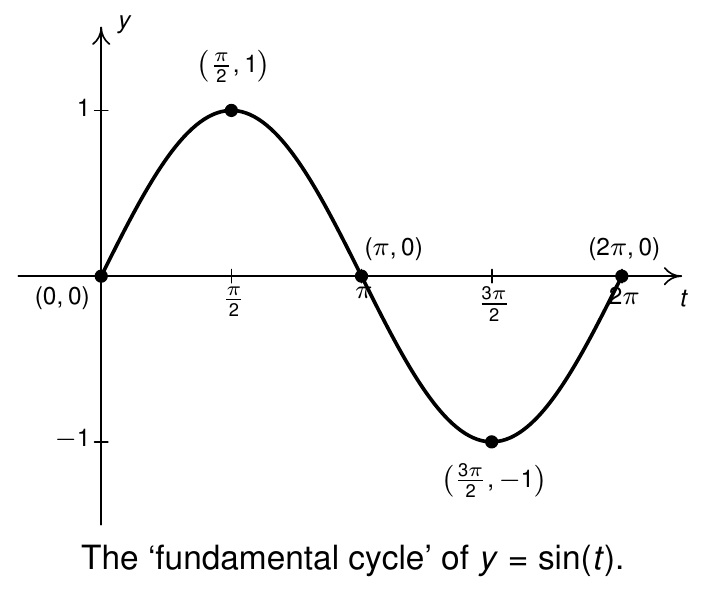
Now that we know the basic shapes of the graphs of $y = \sin(t)$ and $y = \cos(t)$, we can use our knowledge of graphical transformations to graph more complicated functions using transformations. As mentioned already, the fact that both of these functions are periodic means we only have to know what happens over the course of one period of the function in order to determine what happens to all points on the graph. To that end, we graph the fundamental cycle - the portion of each graph generated over the interval $[0, 2\pi]$ - for each of the sine and cosine functions below.
In working through transformations, is very helpful to track `key points' through the transformations. The `key points' we've indicated on the graphs below correspond to the quadrantal angles and generate the zeros and the extrema of functions. Since the quadrantal angles divide the interval $[0,2\pi]$ into four equal pieces, we shall refer to these angles henceforth as the `quarter marks.' We include a table of the 'quarter marks' below the graphs.
| $t $ | $ \sin(t) $ |
|---|---|
| $0 $ | $ 0$ |
| $\frac{\pi}{2} $ | $ 1$ |
| $\pi $ | $ 0$ |
| $\frac{3\pi}{2} $ | $ -1$ |
| $2\pi $ | $ 0$ |

| $t $ | $ \cos(t) $ |
|---|---|
| $0 $ | $ 1$ |
| $\frac{\pi}{2} $ | $ 0$ |
| $\pi $ | $ -1$ |
| $\frac{3\pi}{2} $ | $ 0$ |
| $2\pi $ | $ 1$ |
Graph one cycle of the function. State the period.
$f(t) = 3\sin(2t)$
One way to proceed is to use our CBAD procedure. Here, we have $a = 3$ and $b = 2$. Starting with the fundamental cycle of $y= \sin(t)$, we divide each $t$-coordinate by $2$ and multiply each $y$-coordinate by 3 to obtain one cycle of $y = 3 \sin(2t)$.
| $t $ | $ \sin(t) $ |
|---|---|
| $0 $ | $ 0$ |
| $\frac{\pi}{2} $ | $ 1$ |
| $\pi $ | $ 0$ |
| $\frac{3\pi}{2} $ | $ -1$ |
| $2\pi $ | $ 0$ |
b = 2, so divide the $t$-coordinates by $2$ (or, equivalently, multiply them by $\frac{1}{2}$):
| $\frac{1}{2}\cdot t $ | $ y=\sin(t) $ |
|---|---|
| $\frac{1}{2}\cdot 0=0 $ | $ 0$ |
| $\frac{1}{2}\cdot\frac{\pi}{2}= \frac{\pi}{4} $ | $ 1$ |
| $\frac{1}{2}\cdot\pi = \frac{\pi}{2} $ | $ 0$ |
| $\frac{1}{2}\cdot\frac{3\pi}{2}=\frac{3\pi}{4} $ | $ -1$ |
| $\frac{1}{2}\cdot2\pi = \pi $ | $ 0$ |
Now, keeping those $t$-coordinates, we apply $a = 3$ by multiplying the $y$-coordinates by 3:
| $\frac{1}{2} t $ | $ 3y$ |
|---|---|
| $0 $ | $ 3\cdot 0 = 0$ |
| $\frac{\pi}{4} $ | $ 3\cdot 1 = 3$ |
| $\frac{\pi}{2} $ | $ 3\cdot 0 = 0$ |
| $\frac{3\pi}{4} $ | $ 3\cdot -1 = -3$ |
| $\pi $ | $ 3\cdot 0 = 0$ |
To be sure that we have our numbering scaled correctly on the $t$-axis, it can be useful to rewrite all those $t$-coordinates with a common denominator (in this case, 4). When we do that, we have our final table. When we plot the points in the table, we create one cycle of the transformed sine function, graphed below:
| $t$ | $y$ |
|---|---|
| $0 $ | $ 0$ |
| $\frac{\pi}{4} $ | $ 3$ |
| $\frac{2\pi}{4} $ | $ 0$ |
| $\frac{3\pi}{4} $ | $ -3$ |
| $\frac{4\pi}{4} $ | $ 0$ |

When we compare our transformed function with the fundamental cycle of sin(t), we see that the function has undergone a horizontal compression and a vertical stretch. Since one cycle of $y=f(t)$ is completed over the interval $[0, \pi]$, the period of $f$ is $\pi$.
Graph one cycle of the function. State the period.
$f(t) = 2\cos\left(t+\frac{\pi}{2}\right)+1$
Again, from a transformations perspective, we have $a = 2, c = \frac{\pi}{2}$, and $d = 1$. Going in CBAD order, we will first subtract $\frac{\pi}{2}$ from our $t$-coordinates, then multiply the $y$'s by 2, and finally add 1 to all of the $y$'s. We will condense this work into a single table below, starting with the fudamental cycle in the middle, and working outwards to apply the transformations:
| $\text{apply c}$ | $\leftarrow t $ | $ \cos(t) \rightarrow $ | $ \text{apply a} \rightarrow $ | $ \text{apply d}$ |
|---|---|---|---|---|
| $0-\frac{\pi}{2} = \textcolor{blue}{ -\frac{\pi}{2}} $ | $ 0 $ | $ 1 $ | $ 1\cdot 2 = 2 $ | $ 2+1 = \textcolor{blue}{3}$ |
| $\frac{\pi}{2} - \frac{\pi}{2} = \textcolor{blue}{0} $ | $ \frac{\pi}{2} $ | $ 0 $ | $ 0\cdot 2 = 0$ | $ 0 + 1 = \textcolor{blue}{1} $ |
| $\pi - \frac{\pi}{2} = \textcolor{blue}{\frac{\pi}{2}}$ | $ \pi$ | $ -1$ | $ -1\cdot 2 = -2 $ | $ -2 + 1 = \textcolor{blue}{-1}$ |
| $\frac{3\pi}{2}- \frac{\pi}{2} = \textcolor{blue}{\pi} $ | $\frac{3\pi}{2} $ | $ 0$ | $0\cdot 2 = 0 $ | $ 0 + 1 = \textcolor{blue}{1}$ |
| $2\pi- \frac{\pi}{2} = \textcolor{blue}{\frac{3\pi}{2}}$ | $2\pi $ | $ 1$ | $1\cdot 2 = 2 $ | $ 2 + 1 = \textcolor{blue}{3}$ |
Now, our final transformed $t$-values are in the first column, and the final transformed $y$-values are in the last column. If you like, you can condense these into a final, transformed table, then use that to graph the coordinates of the transformed cosine function:
| $t $ | $ y $ |
| $-\frac{\pi}{2} $ | $ 3$ |
| $0 $ | $ 1$ |
| $\frac{\pi}{2} $ | $ -1$ |
| $\pi $ | $ 1$ |
| $\frac{3\pi}{2} $ | $ 3$ |

We can see that the transformed function has been shifted left, vertically stretched, and shifted up. We find one cycle of $y=g(t)$ is completed over the interval $\left[ -\frac{\pi}{2}, \frac{3\pi}{2} \right]$, the period is $\frac{3\pi}{2} - \left(- \frac{\pi}{2} \right) = 2\pi$.
Features of Sinusoidal Functions
As previously mentioned, the curves graphed in the examples above are examples of sinusoids. A sinusoid is the result of taking the graph of $y = \sin(t)$ or $y = \cos(t)$ and performing any of the transformations mentioned above. We graph one cycle of a generic sinusoid below. Sinusoids can be characterized by four properties: period, phase shift, vertical shift (or 'baseline'), and amplitude.

We have already discussed the period of a sinusoid. If we think of $t$ as measuring time, the period is how long it takes for the sinusoid to complete one cycle and is usually represented by the letter $T$. The standard period of both $\sin(t)$ and $\cos(t)$ is $2\pi$, but horizontal scalings will change this.
In the example above, for instance, the function $f(t) = 3 \sin(2t)$ has period $\pi$ instead of $2\pi$ because the graph is horizontally compressed by a factor of $2$ as compared to the graph of $y = \sin(t)$. However, the period of $g(t) = 2 \cos\left(t +\frac{\pi}{2} \right) +1$ is the same as the period of $\cos(t)$, $2\pi$, since there are no horizontal scalings.
The phase shift of the sinusoid is the overall horizontal shift. Again, thinking of $t$ as time, the phase shift of a sinusoid can be thought of as when the sinusoid 'starts' as compared to $t=0$. Assuming there are no reflections across the $y$-axis, we can determine the phase shift of a sinusoid by finding where the value $t=0$ on the graph of $y = \sin(t)$ or $y=\cos(t)$ is mapped to under the transformations. Consider, then the transformed function $g(t) = a~f(bt + c) + d$. If we want to know where $t=0$ from the parent ends up after these transformations, we consider where $bt + c = 0$. Subtract c and divide by b, and we have $t = -\frac{c}{b}$, which is the phase shift in general for a sinusoidal function.
For $f(t) = 3 \sin(2t)$, the phase shift is '$0$' since the value $t=0$ on the graph of $y = \sin(t)$ remains stationary under the transformations. Loosely speaking, this means both $y=\sin(t)$ and $y=3\sin(2t)$ 'start' at the same time. The phase shift of $g(t) = 2 \cos\left(t +\frac{\pi}{2} \right) +1$ is $-\frac{\pi}{2}$ or `$\frac{\pi}{2}$ to the left' since the value $t = 0$ on the graph of $y=\cos(t)$ is mapped to $t = -\frac{\pi}{2}$ on the graph of $y= 2 \cos\left(t +\frac{\pi}{2} \right) +1$. Again, loosely speaking, this means $y=2 \cos\left(t +\frac{\pi}{2} \right) +1$ starts $\frac{\pi}{2}$ time units earlier than $y=\cos(t)$.
The vertical shift of a sinusoid is exactly the same as the vertical shifts in generic transformations, and determines the new 'baseline' of the sinusoid. Thanks to symmetry, the vertical shift can always be found by averaging the maximum and minimum values of the sinusoid. For $f(t) = 3 \sin(2t)$, the vertical shift is $0$ whereas the vertical shift of $g(t) = 2 \cos\left(t +\frac{\pi}{2} \right) +1$ is $1$ or '$1$ up.'
The amplitude of the sinusoid is a measure of how 'tall' the wave is, as indicated in the figure below. Said differently, the amplitude measures how much the curve gets displaced from its 'baseline. ' The amplitude of the standard cosine and sine functions is $1$, but vertical scalings can alter this.
In the example above, the amplitude of $f(t) = 3 \sin(2t)$ is $3$, owing to the vertical stretch by a factor of $3$ as compared with the graph of $y = \sin(t)$. In the case of $g(t) = 2 \cos\left(t +\frac{\pi}{2} \right) +1$, the amplitude is $2$ due to its vertical stretch as compared with the graph of $y = \cos(t)$. Note that the `$+1$' here does not affect the amplitude of the curve; it merely changes the 'baseline' from $y=0$ to $y=1$.
The following theorem shows how these four fundamental quantities relate to the parameters which describe a generic sinusoid.
Features of sinusoidal functions
The graphs of $$F(t) = A\sin(Bt + C) + D \text{ and } G(T) = A\cos(B t + C) + D$$ have the following features:
- period $T = \frac{2\pi}{|B|}$
- amplitude $|A|$
- phase shift $-\frac{C}{B}$
- vertical shift or 'baseline' $D$
$f(t) = 3\cos\left(\frac{\pi t - \pi}{2}\right) + 1$
First, we need to rewrite $f(t)$ in the form prescribed by our CBAD methodology. To that end, we rewrite: $f(t) = 3 \cos\left(\frac{\pi t - \pi}{2}\right) + 1 = 3\cos\left(\frac{\pi}{2} t + \left(-\frac{\pi}{2}\right)\right) + 1$.
From this, we identify $A = 3$, $B = \frac{\pi}{2}$, $C = -\frac{\pi}{2}$ and $D = 1$. Therefore, the period is $T=\frac{2\pi}{|B|} = \frac{2\pi}{\pi/2} = 4$, the phase shift is $-\frac{C}{B} = -\frac{-\pi/2}{\pi/2} = 1$ (indicating a shift to the right $1$ unit), the amplitude is $|A| = |3| = 3$, and the vertical shift is $D = 1$ (indicating a shift up $1$ unit.
If we graph this function using our transformation strategies, we will see all of these features.
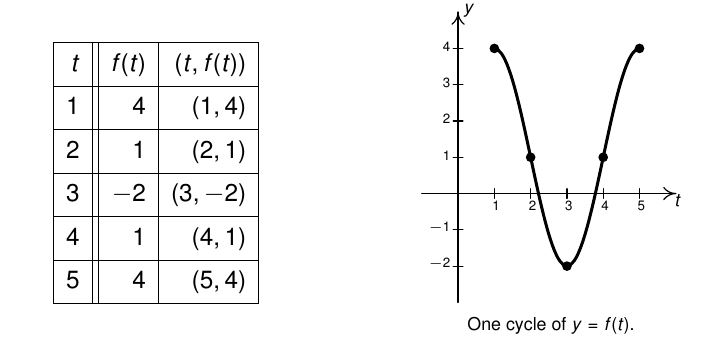
The cycle starts at $t= 1$ and ends at $t = 5$, giving a period of $5 - 1 = 4$. The start of the cycle has been shifted from $t = 0$ to $t = 1$, hence we have a phase shift of 1. The baseline has been shifted up from $y = 0$ to $y = 1$, showcasing the vertical shift. Finally, the distance from that baseline to the top of the cycle (from 1 to 4) is 3, the amplitude.
$f(t) = \frac{1}{2}\sin\left(\pi - 2t\right) + \frac{3}{2}$
We first note that the $t$ comes second inside the function, which will confuse things from our CBAD perspective. We can reorder that inside so that we have $f(t) = \frac{1}{2}\sin(-2t + \pi) + \frac{3}{2}$, and now identify $A = \frac{1}{2}, B = -2, C = \pi$, and $D = \frac{3}{2}$.
Now we find that the period is $T=\frac{2\pi}{|B|} = \frac{2\pi}{|-2|} = \pi$, the phase shift is $-\frac{C}{B} = -\frac{\pi}{-2} = \frac{\pi}{2}$ (indicating a shift to the right $\frac{\pi}{2}$ unit), the amplitude is $|A| = |\frac{1}{2}| = \frac{1}{2}$, and the vertical shift is $D = \frac{3}{2}$ (indicating a shift up $\frac{3}{2}$ unit.
If we graph this function using our transformation strategies, we will see all of these features.
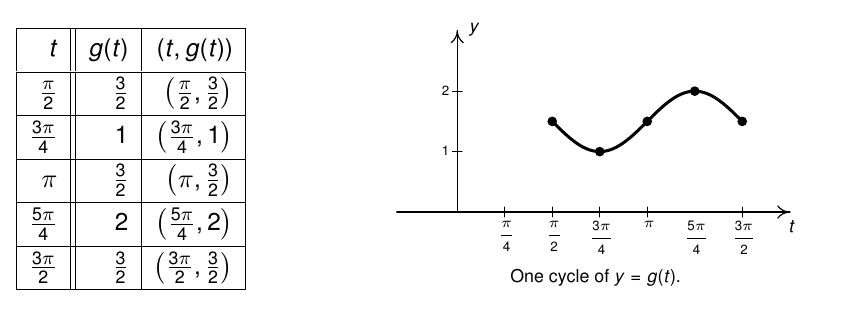
The cycle starts at $t= \frac{\pi}{2}$ and ends at $t = \frac{3\pi}{2}$, giving a period of $\frac{3\pi}{2}-\frac{\pi}{2} = \pi$. The start of the cycle has been shifted from $t = 0$ to $t = \frac{\pi}{2}$, hence we have a phase shift of $\frac{\pi}{2}$. The baseline has been shifted up from $y = 1$ to $y = 3/2$, showcasing the vertical shift. Finally, the distance from that baseline to the top of the cycle (from 3/2 to 2) is 1/2, the amplitude.
In the next example, we use the properties of sinusoidal functions to determine the formula of a sinusoid given the graph of one cycle. Note that in some disciplines, sinusoids are written in terms of sines whereas in others, cosines functions are preferred. To cover all bases, we ask for both.
Below is the graph of one complete cycle of a sinusoid $y=f(t)$.

a. Write $f(t)$ in the form $G(t) = A\cos(B t + C) + D$.
A useful strategy is to think about this in the reverse of CBAD: first let's look for D, a vertical shift. We notice the "middle" points are at a height of $\frac{1}{2}$, implying a vertical shift, so $D = \frac{1}{2}$.
Next, we look for the amplitude. From the baseline to the top of the curve, there is a distance of $\frac{5}{2}-\frac{1}{2} = 2$, indicating the amplitude is 2, and $|A| = 2$. In this case we will choose to make $A = 2$, because if we look at the "starting" point of the curve at $(-1, \frac52)$, we see this point is at the top of the cycle, so we won't be thinking of this graph as having any reflections about the $y$-axis, making a positive $A$ value an appropriate choice.
Now we consider our horizontal transformations. We know that the cycle starts at $t = -1$ and ends at $t = 5$, so the period is $5 - (-1) = 6$. Since the period is also $\frac{2\pi}{|B|}$, we can solve for $B$: $$\frac{2\pi}{|B|} = 6$$ $$2\pi = 6|B|$$ $$|B| = \frac{\pi}{3}$$ Here, for simplicity, let's say $B = \frac{\pi}{3}$, so we won't have to worry about thinking through any reflections about the y-axis.
Finally, observe that the fundamental cosine function starts at the top of the cycle, then travels down; here, that top of the cycle starts at $t = -1$, implying that the phase shift is $-1$, so $-\frac{C}{B} = -1$. We can substitute in $\frac{\pi}{3}$ for B and solve for C: $$-\frac{C}{\pi/3} = -1$$ $$-C= -\frac{\pi}{3}$$ $$C = \frac{\pi}{3}$$ Therefore, we conclude that the function is $G(t) = 2\cos(\frac{\pi}{3} t + \frac{\pi}{3}) + \frac{1}{2}$.
b. Write $f(t)$ in the form $F(t) = A\sin(B t + C) + D$.
Most of our thought process here will likely be the same. We know $D = \frac{1}{2}$, and $|A| = 2$. This time, though, we'll need to consider how to treat those absolute value bars. Recall that the fundamental cycle of sine starts at 0, then goes up to the top of the cycle. If we look at our first point on the baseline of this graph, $\left(\frac{1}{2}, \frac{1}{2}\right)$, the curve proceeds down to the bottom of the cycle instead. This indicates we have a vertical reflection, so we should let $A = -2$.
We can still use $B = \frac{\pi}{3}$ (based off of the same period of 6), but now we'll tweak our treatment of the phase shift and C. If we consider $\left(\frac{1}{2}, \frac{1}{2}\right)$ to be the start of our cycle, then the phase shift is $\frac{1}{2}$. Hence $$\frac{1}{2} = -\frac{C}{B}$$ $$\frac{1}{2} = -\frac{C}{\pi/3}$$ $$-C = \frac{\pi}{6}$$ $$C = -\frac{\pi}{6}$$ This time, then, we find that the function is $F(t) = -2\sin(\frac{\pi}{3} t - \frac{\pi}{6}) + \frac{1}{2}$.
Now, we could instead choose to treat $\left(\frac{7}{2}, \frac{1}{2}\right)$ as the start of the cycle. In this case, the function goes up as it should, so we can keep our A-value positive. This time, the phase shift becomes $\frac{7}{2}$, and when we solve for $C$, we get $-\frac{7\pi}{6}$. Therefore, another valid answer is $F(t) = 2\sin(\frac{\pi}{3} t - \frac{7\pi}{6})+\frac{1}{2}$!
Practice Problems
In the following exercises, graph one cycle of the given function. State the period, amplitude, phase shift and vertical shift of the function.
1. $f(t) = 3\sin(t)$
2. $g(t) = \sin(3t)$
3. $h(t) = -2\cos(t)$
4. $f(t) = \cos \left( t - \frac{\pi}{2} \right)$
5. $g(t) = -\sin \left( t + \frac{\pi}{3} \right)$
6. $h(t) = \sin(2t - \pi)$
7. $f(t) = -\frac{1}{3}\cos \left( \frac{1}{2}t + \frac{\pi}{3} \right)$
8. $g(t) = \cos (3t - 2\pi) + 4$
9. $h(t) = \sin \left( -t - \frac{\pi}{4} \right) - 2$
10. $f(t) = \frac{2}{3} \cos \left( \frac{\pi}{2} - 4t \right) + 1$
11. $g(t) = -\frac{3}{2} \cos \left( 2t + \frac{\pi}{3} \right) - \frac{1}{2}$
12. $h(t) = 4\sin (-2\pi t + \pi)$
1. $f(t) = 3\sin(t)$
Period: $2\pi$
Amplitude: $3$
Phase Shift: $0$
Vertical Shift: $0$
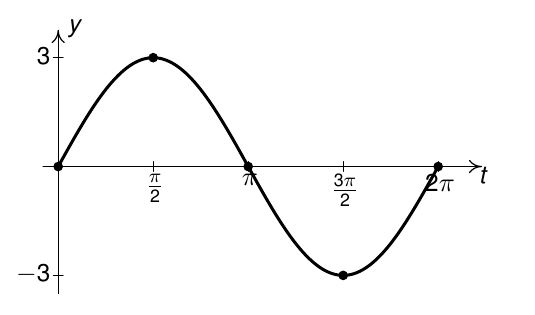
2. $g(t) = \sin(3t)$
Period: $\frac{2\pi}{3}
Amplitude: $1$
Phase Shift: $0$
Vertical Shift: $0$

3. $h(t) = -2\cos(t)$
Period: $2\pi$
Amplitude: $2$
Phase Shift: $0$
Vertical Shift: $0$

4. $f(t) = \cos \left( t - \frac{\pi}{2} \right)$
Period: $2\pi$
Amplitude: $1$
Phase Shift: $\frac{\pi}{2}$
Vertical Shift: $0$
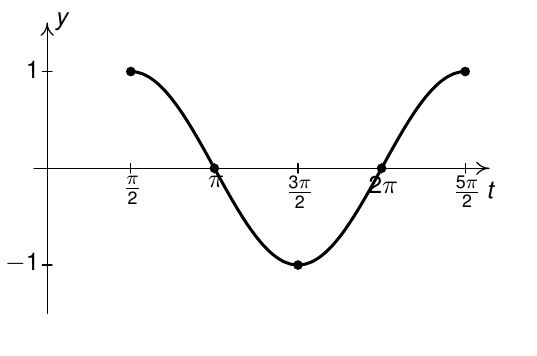
5. $g(t) = -\sin \left( t + \frac{\pi}{3} \right)$
Period: $2\pi$
Amplitude: $1$
Phase Shift: $-\frac{\pi}{3}$
Vertical Shift: $0$
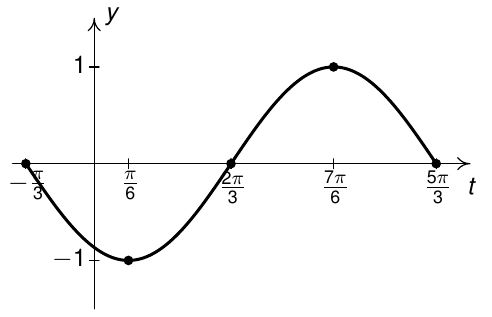
6. $h(t) = \sin(2t - \pi)$
Period: $\pi$
Amplitude: $1$
Phase Shift: $\frac{\pi}{2}$
Vertical Shift: $0$

7. $f(t) = -\frac{1}{3}\cos \left( \frac{1}{2}t + \frac{\pi}{3} \right)$
Period: $4\pi$
Amplitude: $\frac{1}{3}$
Phase Shift: $-\frac{2\pi}{3}$
Vertical Shift: $0$

8. $g(t) = \cos (3t - 2\pi) + 4$
Period: $2\pi
Amplitude: $1$
Phase Shift: $-\frac{\pi}{4}$
Vertical Shift: $-2$

9. $h(t) = \sin \left( -t - \frac{\pi}{4} \right) - 2$
Period: $\frac{2\pi}{3}$
Amplitude: $1$
Phase Shift: $\frac{2\pi}{3}$
Vertical Shift: $4$

10. $f(t) = \frac{2}{3} \cos \left( \frac{\pi}{2} - 4t \right) + 1$
Period: $\frac{pi}{2}$
Amplitude: $\frac{2}{3}$
Phase Shift: $\frac{\pi}{8}$
Vertical Shift: $1$

11. $g(t) = -\frac{3}{2} \cos \left( 2t + \frac{\pi}{3} \right) - \frac{1}{2}$
Period: $\pi$
Amplitude: $\frac{3}{2}$
Phase Shift: $-\frac{\pi}{6}$
Vertical Shift: $-\frac{1}{2}$
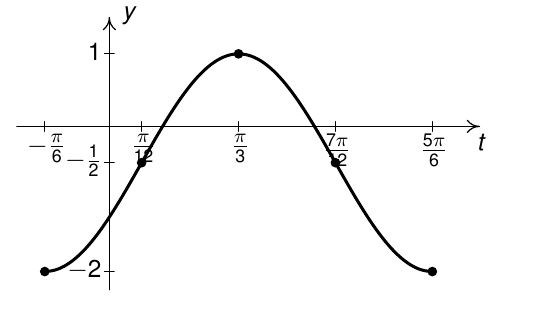
12. $h(t) = 4\sin (-2\pi t + \pi)$
Period: $1$
Amplitude: $4$
Phase Shift: $\frac{1}{2}$
Vertical Shift: $0$

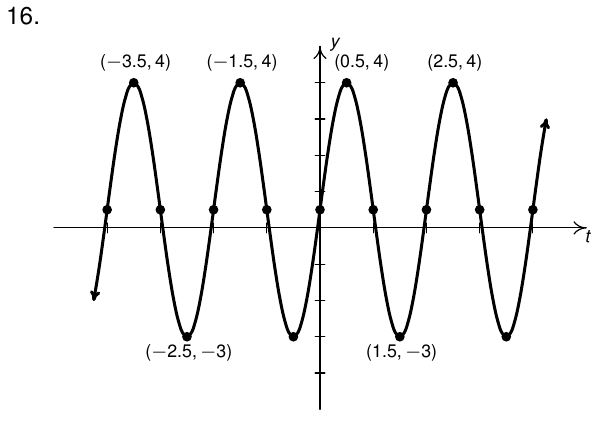
In the following exercises, a sinusoid is graphed. Find a formula for the sinusoid in the form $S(t) = A \sin(B t + C) + D$ and $C(t) = A \cos(B t + C) + D$. Check your answer by graphing.


13. $S(t) = 4 \sin \left(t + \frac{\pi}{4} \right)$, $C(t) = 4 \cos \left(t - \frac{\pi}{4} \right)$
14. $S(t) = -3 \sin(t) + 3$, $C(t) = -3 \cos\left(t - \frac{\pi}{2}\right) + 3$
15. $S(t) = 3 \sin \left( 2t - \frac{\pi}{3} \right)$, $C(t) = 3 \cos \left( 2t - \frac{5\pi}{6} \right)$
16. $S(t) = \frac{7}{2} \sin(\pi t) + \frac{1}{2}$, $C(t) = \frac{7}{2} \cos\left(\pi t \frac{\pi}{2} \right) + \frac{1}{2}$
In the following exercises, use a graphing utility to graph each function and discuss the related questions with your classmates.
17. $f(t) = \cos(3t) + \sin(t)$. Is this function periodic? If so, what is the period?
18. $f(t) = \frac{\sin(t)}{t}$. What appears to be the horizontal asymptote of the graph?
19. $f(t) = t \sin(t)$. Graph $y = \pm t$. What do you notice?
20. $f(t) = \sin\left(\frac{1}{t}\right)$. What's happening as $t \rightarrow 0$?
21. $f(x) = x - \tan(x)$. Graph $y = x$ on the same set of axes and describe the behavior of $f$.
22. $f(t) = e^{-0.1t} \left( \cos(2t) + \sin(2t)\right)$. Graph $y = \pm e^{-0.1t}$ on the same set of axes. What do you notice?
23. $f(t) = e^{-0.1t} \left( \cos(2t) + 2\sin(t)\right)$. Graph $y = \pm e^{-0.1t}$ on the same set of axes. What do you notice?
Homework Set
- Consider $f(x) = 5\sin\left(\frac12 x\right)$
- What does the 5 do to the graph of the parent function?
- What does the $\frac12$ do to the graph of the parent function?
- Sketch a graph of $f(x)$ over two periods.
- Consider $f(x) = -3\cos\left(\frac{\pi}{4} x\right)+2$
- What does the -3 do to the graph of the parent function?
- What does the $\frac{\pi}{4}$ do to the graph of the parent function?
- What does the 2 do to the graph of the parent function?
- Sketch a graph of $f(x)$ over two periods.
- Consider $f(x) = \sin\left(\frac{\pi}{3} x\right)+1$
- What does the $\frac{\pi}{3}$ do to the graph of the parent function?
- What does the 1 do to the graph of the parent function?
- Sketch a graph of $f(x)$ over two periods.
- Consider $f(x) = 2\cos\left(x-\pi\right)$
- What does the 2 do to the graph of the parent function?
- What does the $-\pi$ do to the graph of the parent function?
- Sketch a graph of $f(x)$ over two periods.
- Consider $y = 3\cos(5x-2\pi)+1$.
- Graph $y$ over two periods.
- What is the amplitude?
- What is the period?
- What is the phase shift?
- What is the vertical shift?
- Illustrate how we can see parts b-e on the graph.
- Consider $y = -4\sin(4x+\pi)-1$.
- Graph $y$ over two periods.
- What is the amplitude?
- What is the period?
- What is the phase shift?
- What is the vertical shift?
- Illustrate how we can see parts b-e on the graph.
- Consider $y = 1-\cos(3x-2\pi)$.
- Graph $y$ over two periods.
- What is the amplitude?
- What is the period?
- What is the phase shift?
- What is the vertical shift?
- Illustrate how we can see parts b-e on the graph.
- Consider the sinusoidal graph below:

Find the following:
- Amplitude
- Period
- Midline
- Consider the sinusoidal graph below:

Find the following:
- Amplitude
- Period
- Midline
- Find a function of the form $y=a\sin(bx+c)+d$ or $y = a\cos(bx + c) + d$ whose graph matches the function shown below:

- Find a function of the form $y=a\sin(bx+c)+d$ or $y = a\cos(bx + c) + d$ whose graph matches the function shown below:
